The boilerplate includes two admin dashboards: a platform-wide super admin and an organization-level admin for B2B workspaces.
Platform Admin Dashboard
Located at /admin-dashboard, accessible only to users with is_admin=true in their profile.
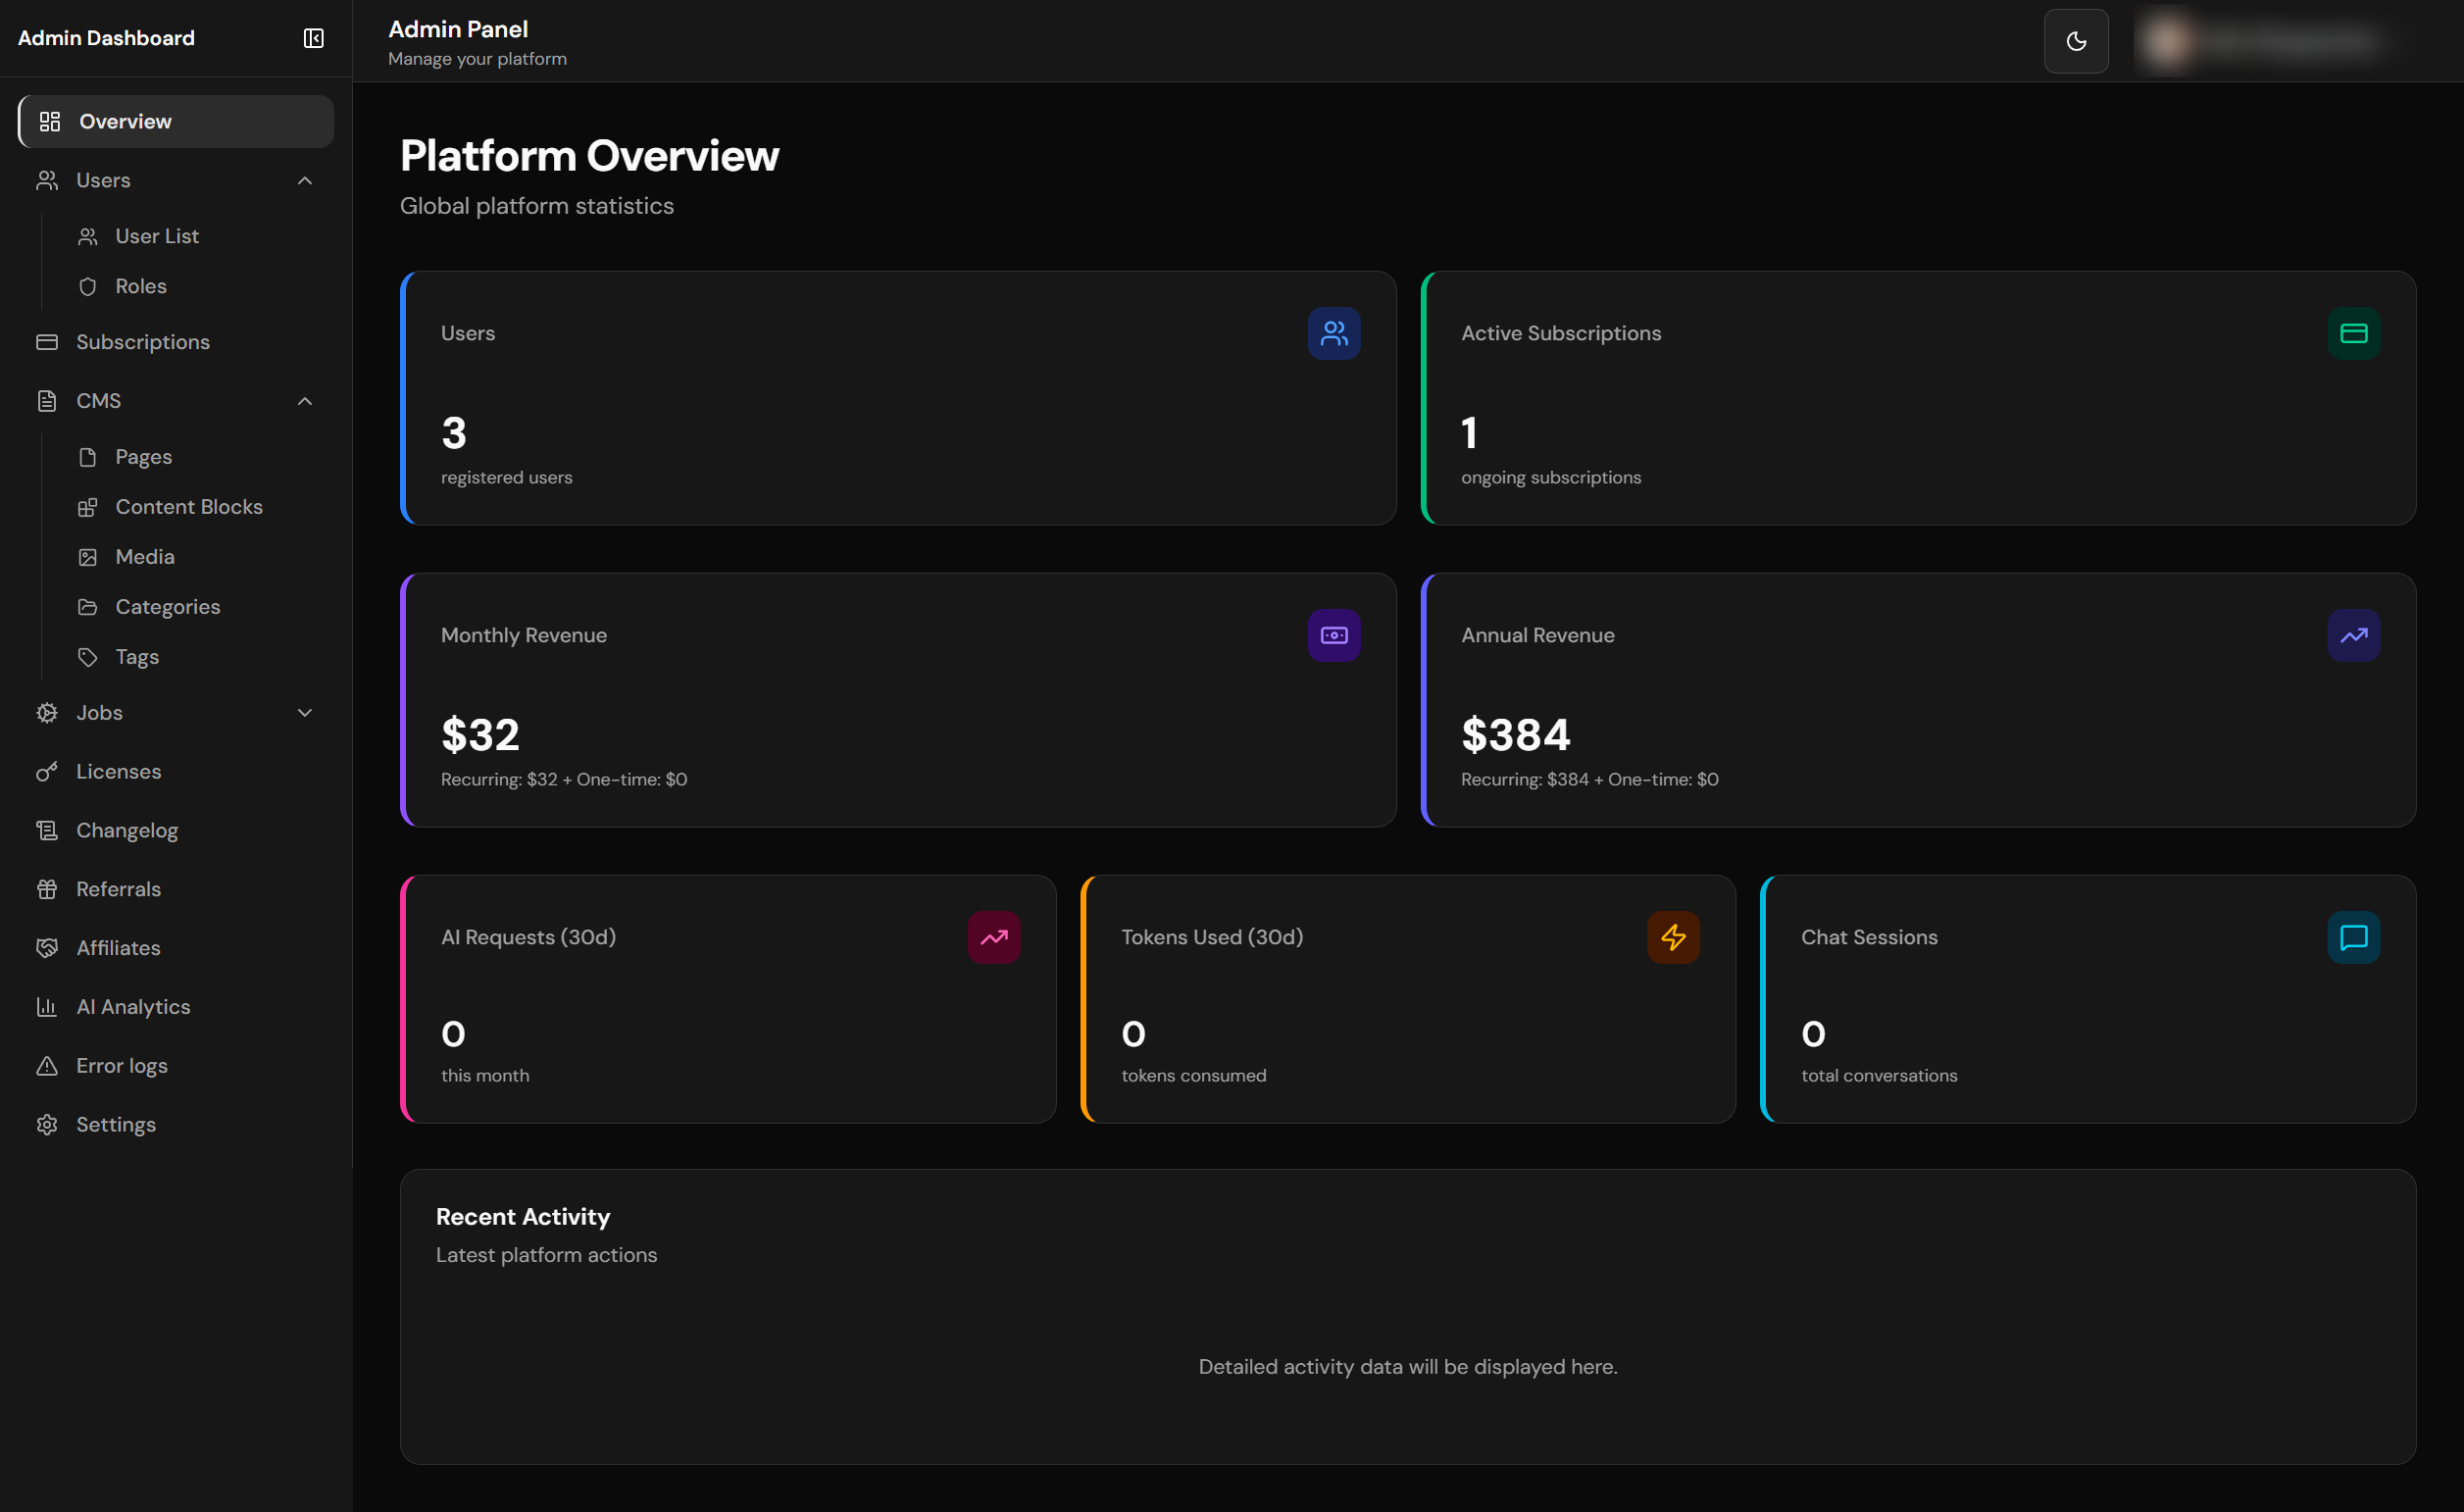
Platform admin dashboard with KPIs and overview
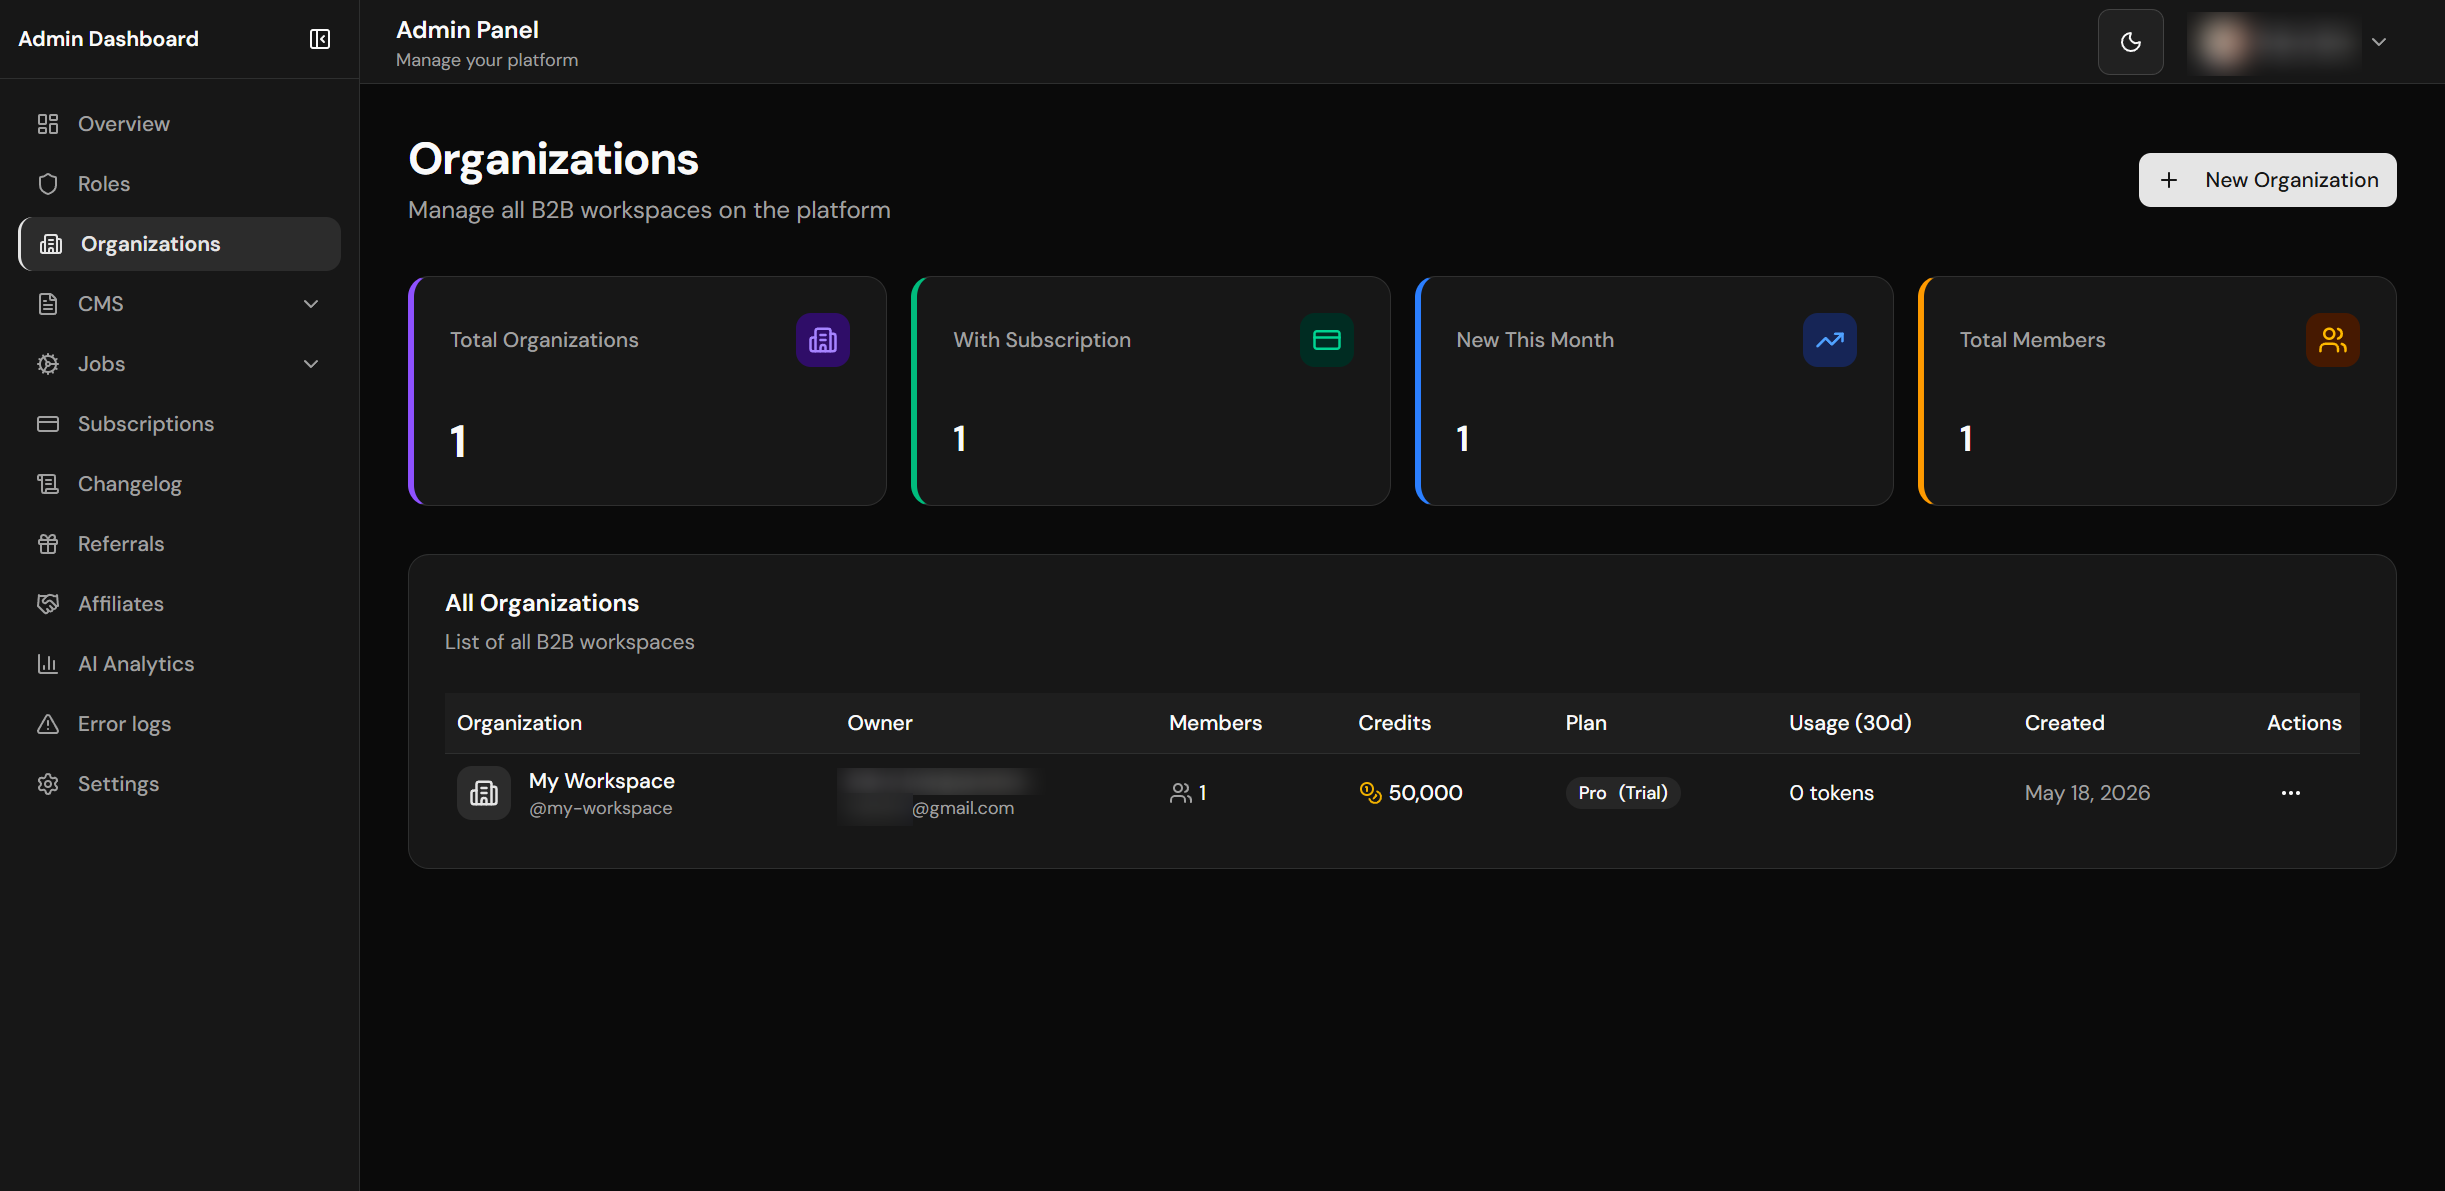
Organizations management
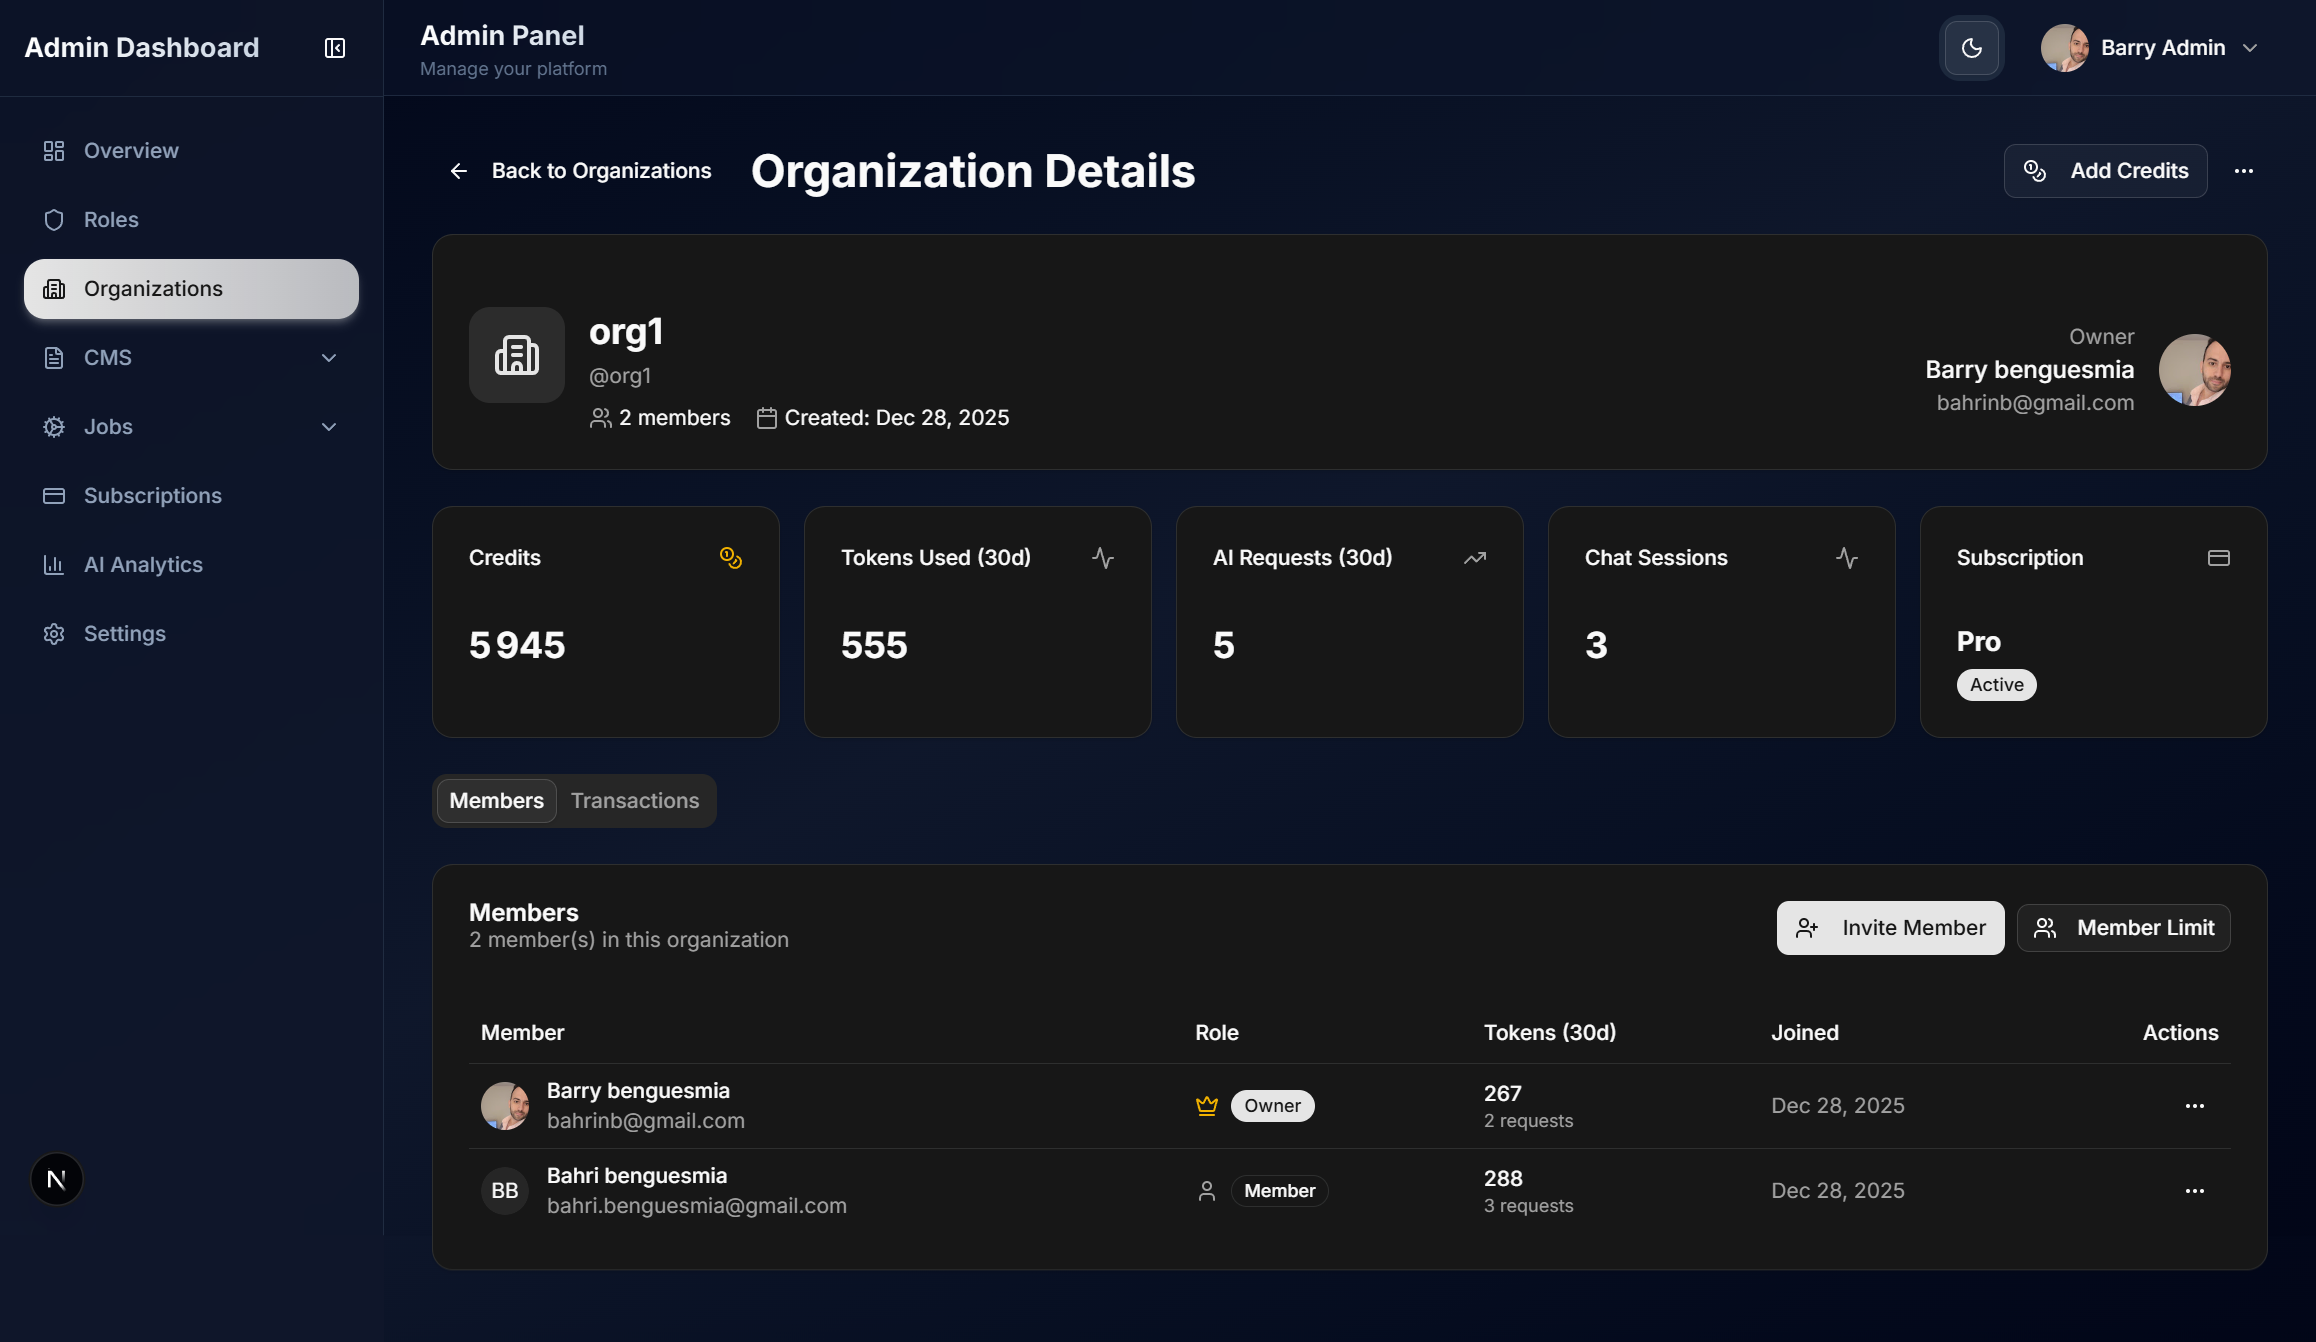
Organization detail view
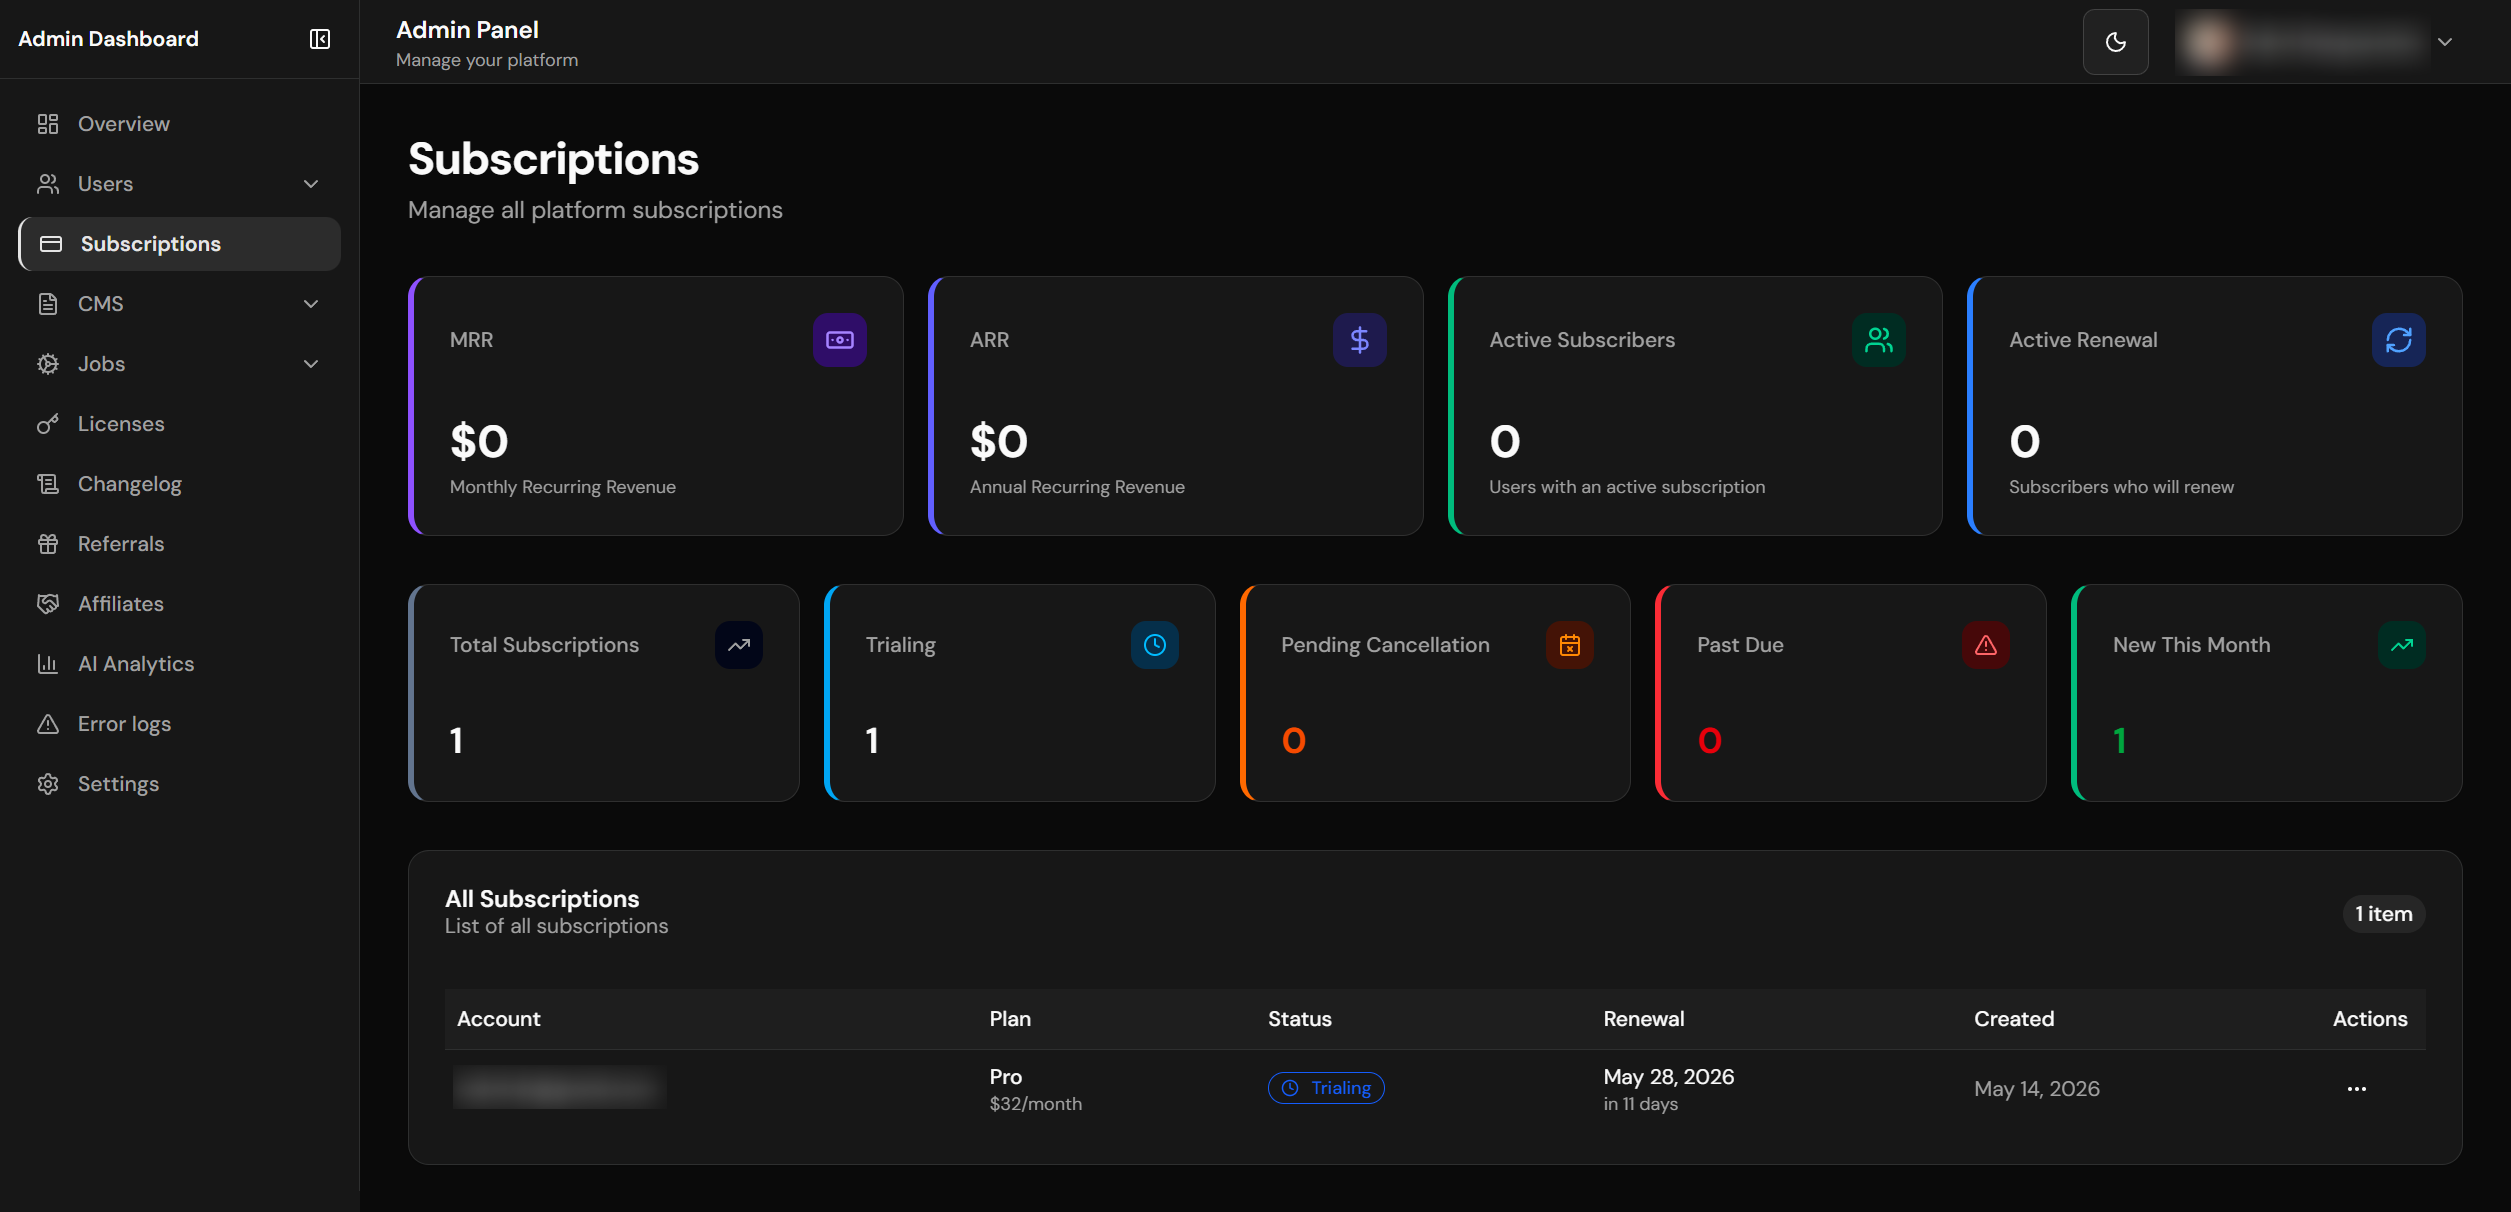
Subscriptions overview
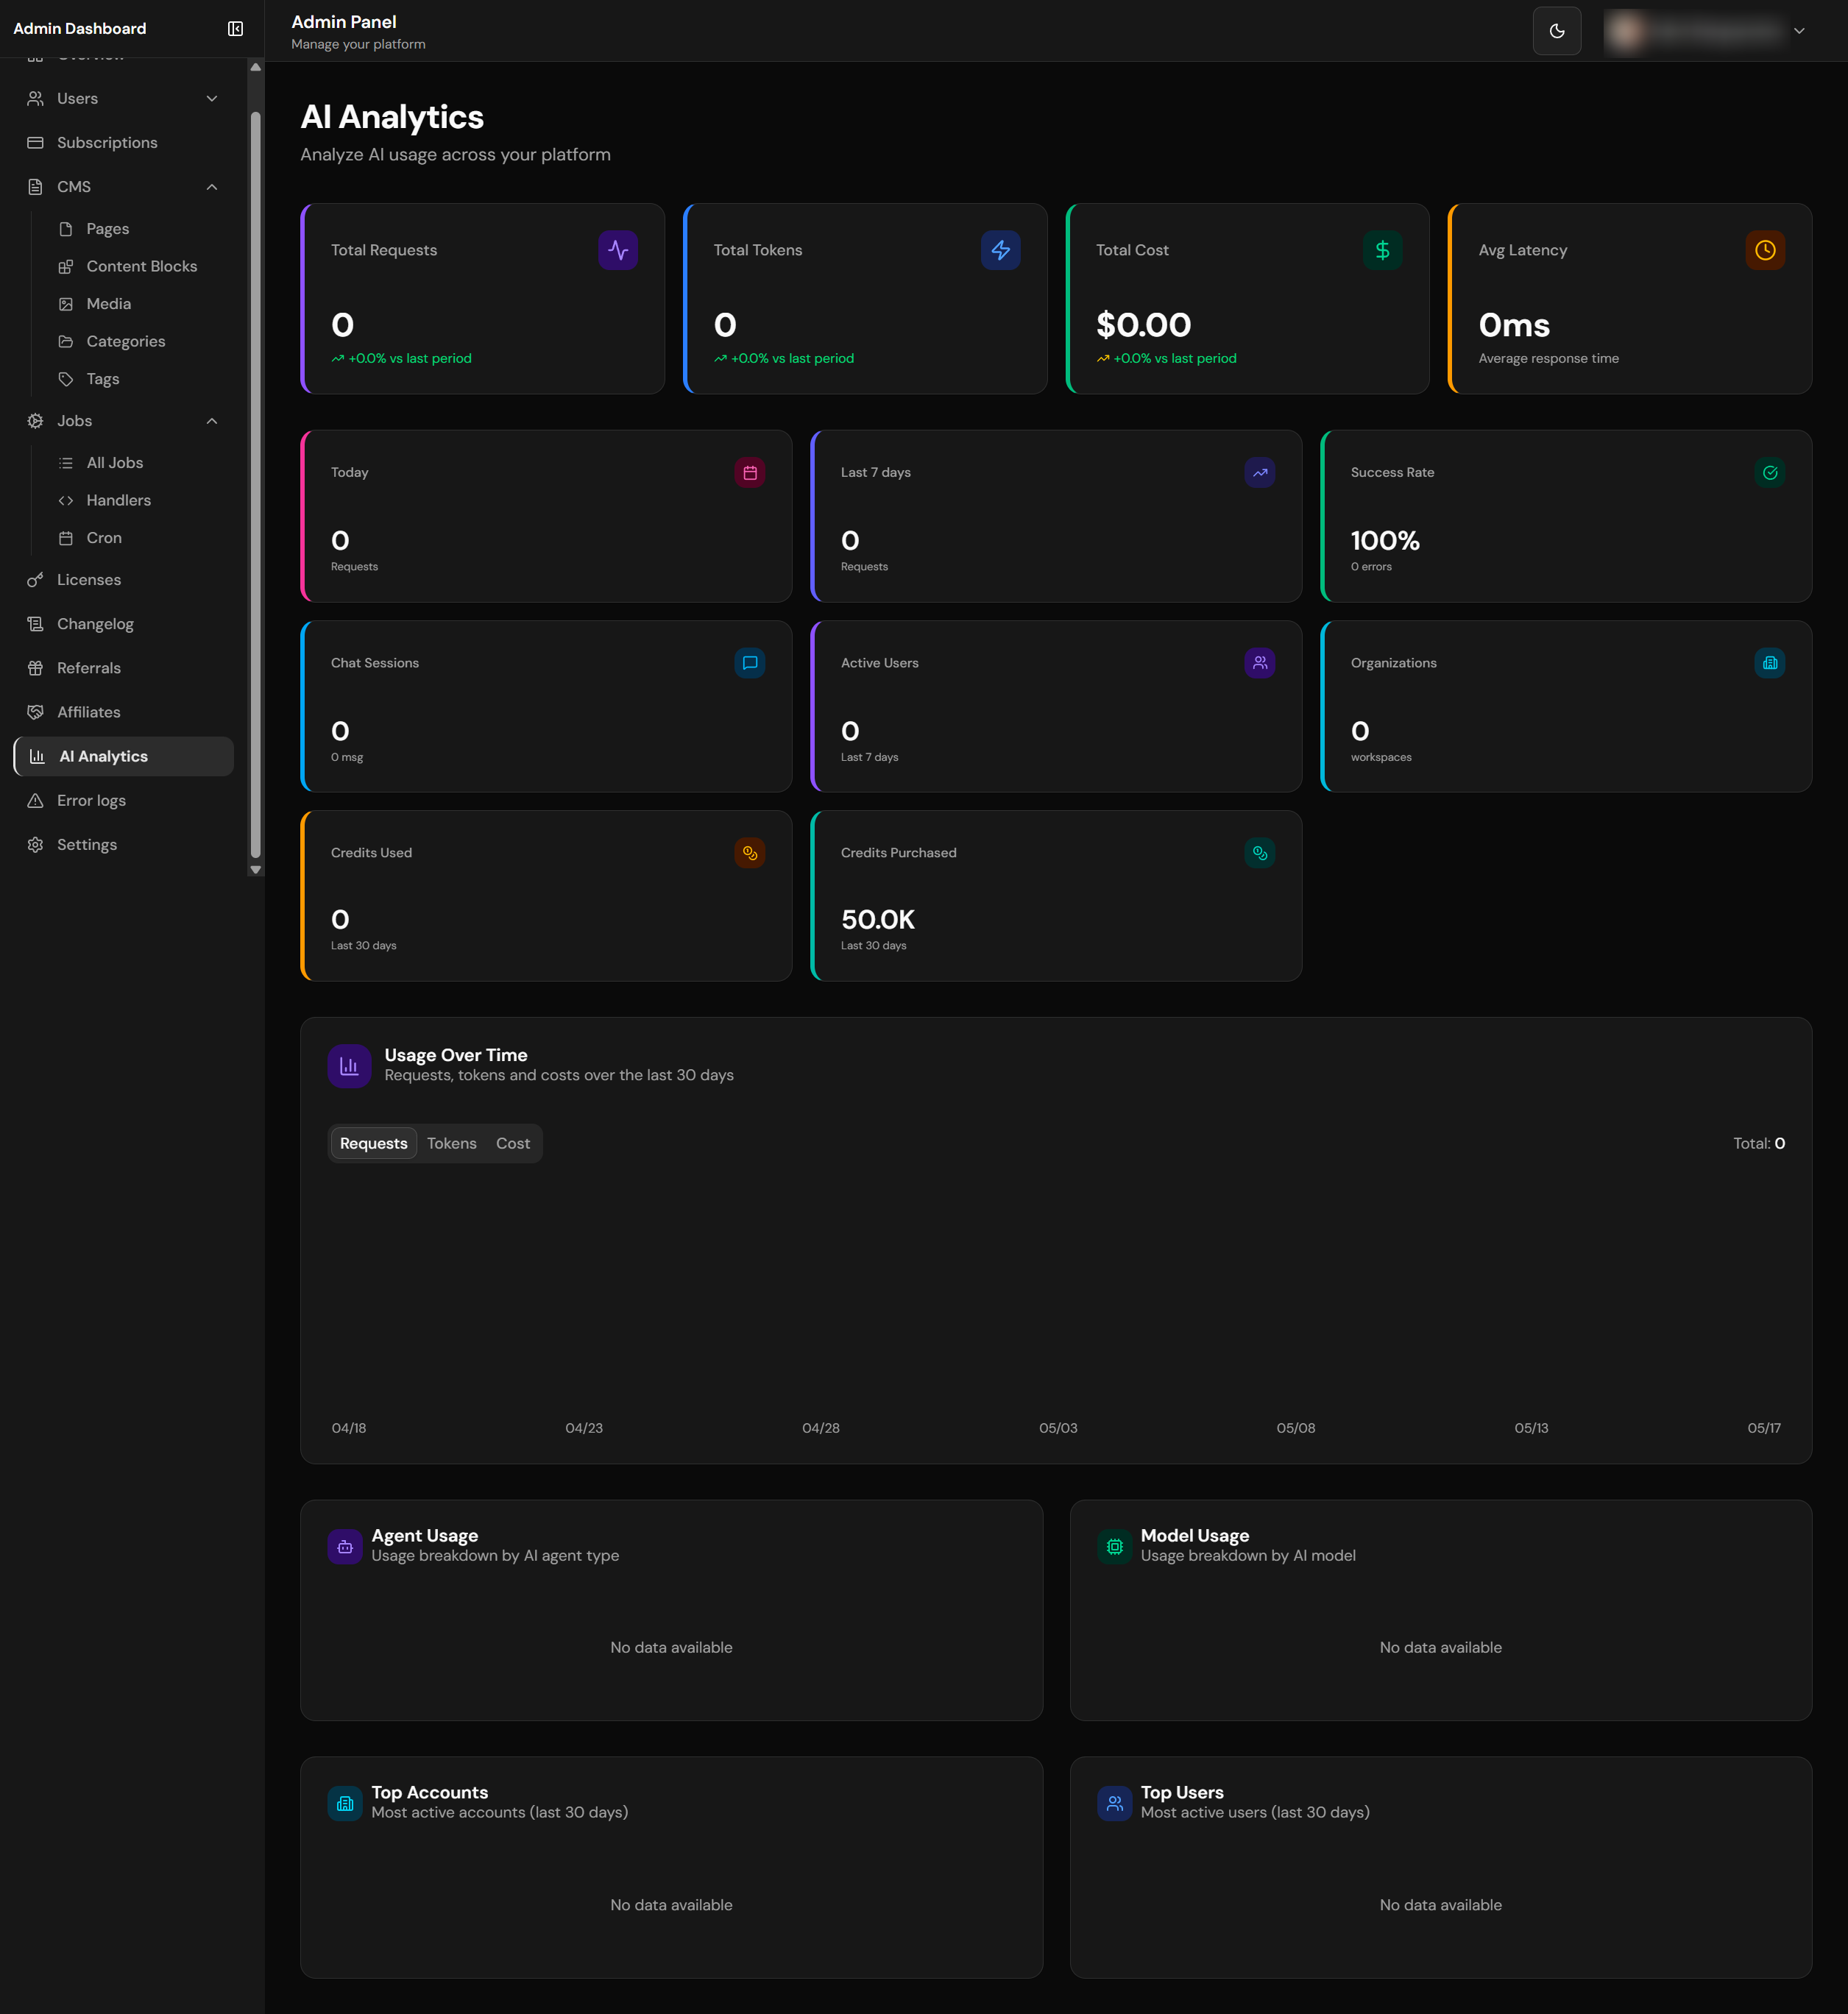
Platform-wide AI analytics
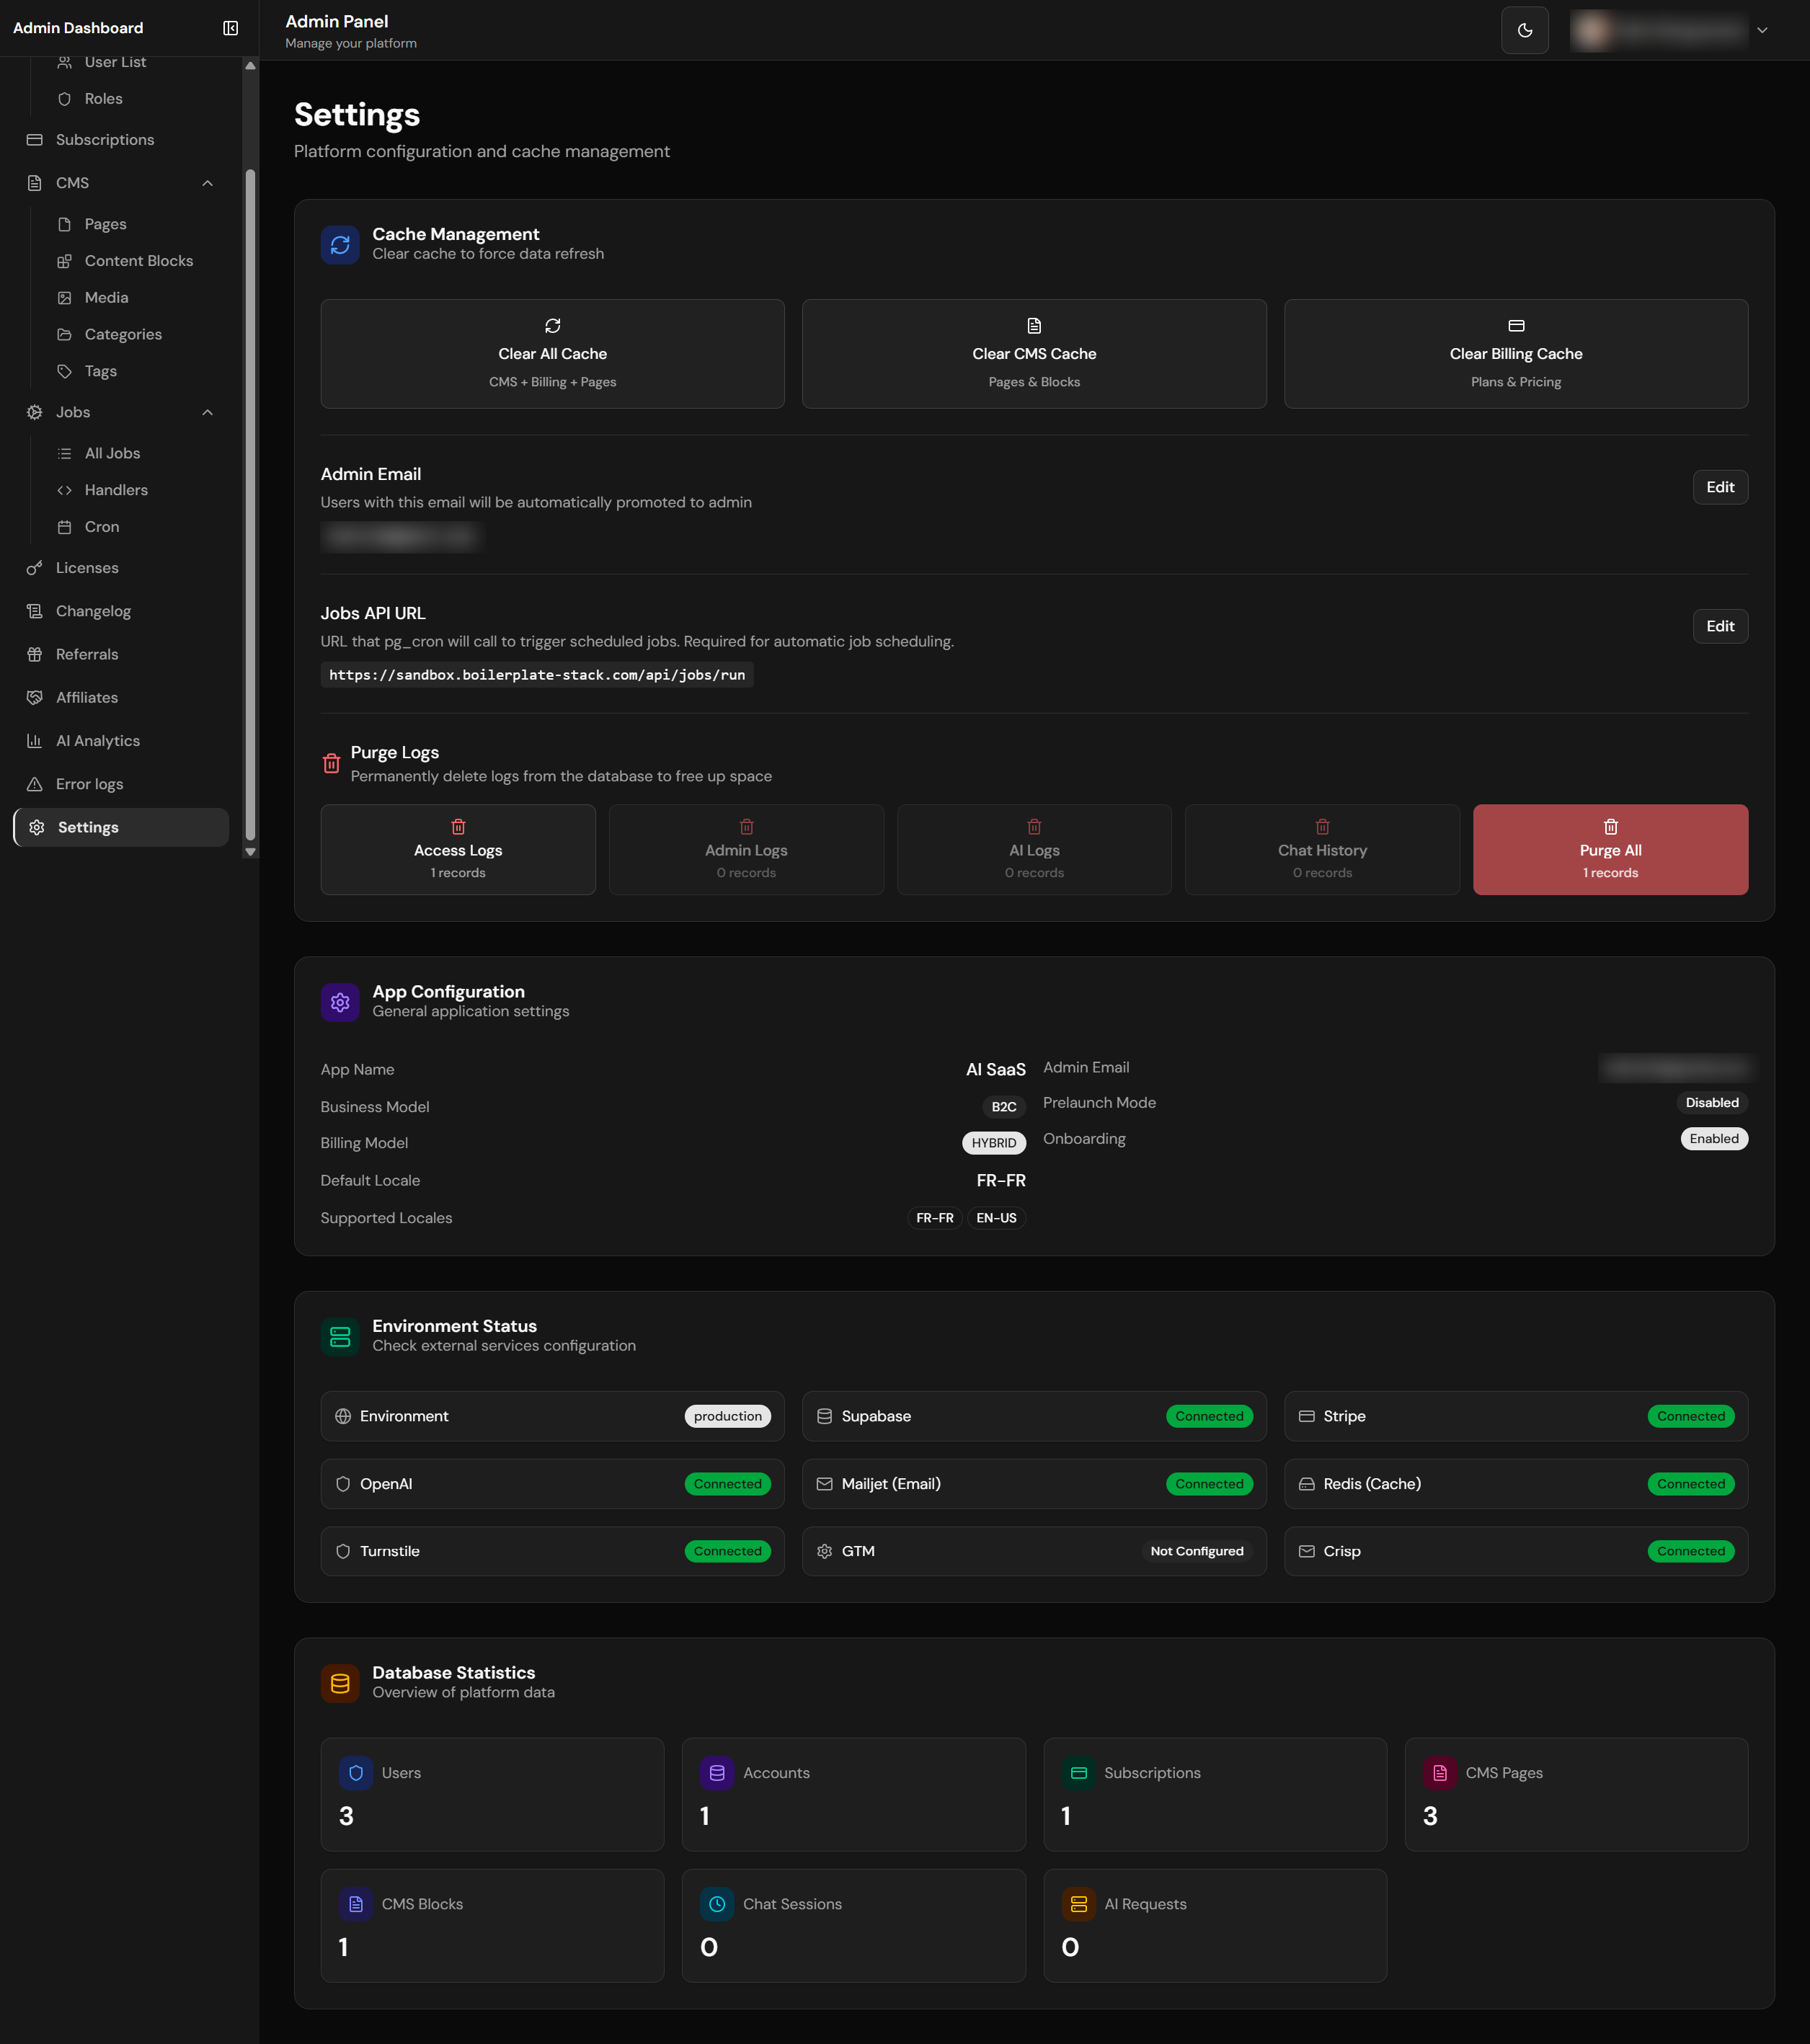
Platform settings configuration
Auto-Admin Assignment
The admin check uses the shared maybeAutoPromoteAdmin() helper so layout and API admin verification follow the same auto-fix path:
- Compares user email with
admin_emailinapp_settingstable - If email matches but
is_admin=false, automatically updates tois_admin=true - Works in both layout (server-side) and API routes without duplicating the update/audit logic
- Uses
supabaseAdmin(service role) to bypass RLS
Admin dashboard pages are thin Server Components. Platform-wide reads for the overview, analytics, and settings pages live in core/admin/overview.ts, core/admin/analytics.ts, and core/admin/settings.ts. Destructive admin routes delegate to focused core action modules such as core/affiliates/admin-actions.ts, which keeps audit logging and cache revalidation reusable outside the HTTP route.
Dashboard Pages
| Page | Path | Features |
|---|---|---|
| Overview | /admin-dashboard |
Total users, orgs, active subscriptions, MRR/ARR, AI stats |
| Analytics | /admin-dashboard/analytics |
AI requests (total/30d/7d/today), tokens, costs, charts, top users |
| Users | /admin-dashboard/users |
User management, disable/enable, view details |
| Organizations | /admin-dashboard/organizations |
Workspace management, member limits, subscription status |
| Subscriptions | /admin-dashboard/subscriptions |
All subscriptions, plan breakdown, status filters |
| Referrals | /admin-dashboard/referrals |
Referral monitoring, stats, manual reverse/reject (gated by REFERRAL_ENABLED) |
| Affiliates | /admin-dashboard/affiliates |
Affiliate applications queue, conversions, manual reversal (gated by AFFILIATES_ENABLED) |
| Logs | /admin-dashboard/logs |
Server-side error logs, cursor-paginated, category/level filters (gated by LOGS_ENABLED) |
| Licenses | /admin-dashboard/licenses |
License management, revenue, expiration tracking, revoke/extend actions |
| Changelog | /admin-dashboard/changelog |
Create, edit, publish/unpublish changelog entries. Multi-locale support. Toggle via appConfig.features.changelog |
| Roles | /admin-dashboard/roles |
Dynamic role management, permissions, colors, icons |
| CMS | /admin-dashboard/cms |
Pages, blocks, media library management |
| Jobs | /admin-dashboard/jobs |
Background jobs, handlers, run history |
| Settings | /admin-dashboard/settings |
Platform settings, cache management, environment status, database stats, log purging |
KPI Performance
Dashboard queries are optimized for performance:
- Server Component pages render pre-aggregated data from
core/admin/*modules instead of inlining service-role query orchestration - Parallel database queries with
Promise.all(9 queries in parallel) - MRR/ARR calculation from
pricingConfig(code-based, not DB) - Efficient counting with
count: 'exact', head: true - Explicit projections such as
select('id')orselect('amount')instead ofselect('*')for production queries supabaseAdminbypasses RLS for platform-wide stats
Admin Dashboard Design System
The admin dashboard follows a Data-Dense Dashboard design pattern optimized for information density and at-a-glance insights. The design uses shadcn/ui components with Tailwind CSS v4 theme tokens.
| Element | Pattern | Example Classes |
|---|---|---|
| Stat/KPI Cards | Bordered card with colored left accent matching the icon color | bg-card border border-border border-l-4 border-l-blue-500 shadow-sm hover:shadow-md transition-shadow duration-200 |
| Card Icons | Tinted background circle with colored icon | h-9 w-9 rounded-lg bg-blue-50 dark:bg-blue-950 + text-blue-600 dark:text-blue-400 |
| Primary KPI Values | Large bold for top-level metrics | text-3xl font-bold text-foreground |
| Secondary Values | Slightly smaller for supporting stats | text-2xl font-semibold text-foreground |
| Table Containers | Clean card without colored accent | bg-card border border-border |
| Table Headers | Subtle muted background for scanning | TableHeader className="bg-muted/50" |
| Table Rows | Hover highlight for interactivity | hover:bg-muted/50 transition-colors |
| Page Headers | Clean foreground text, no gradients | text-3xl font-bold tracking-tight text-foreground |
| Sidebar Active Item | Tinted background with left accent indicator | bg-primary/10 text-primary font-semibold border-l-2 border-l-primary |
When designing pages, Claude Code follows a 4-tier skill pipeline: (1) Foundation skills (/tailwind-v4-shadcn + /ui-ux-pro-max) are always invoked, (2) ONE aesthetic skill sets the visual direction (e.g., /impeccable), (3) Refinement skills (/typeset, /animate, etc.) polish specific aspects, (4) Workflow skills (/critique, /polish) handle review and shipping. All colors must use oklch() theme tokens — never raw hex. See .claude/rules/design-skills.md for the full orchestration guide.
Organization Admin Dashboard
Located at /org-dashboard, accessible to workspace owners and admins.
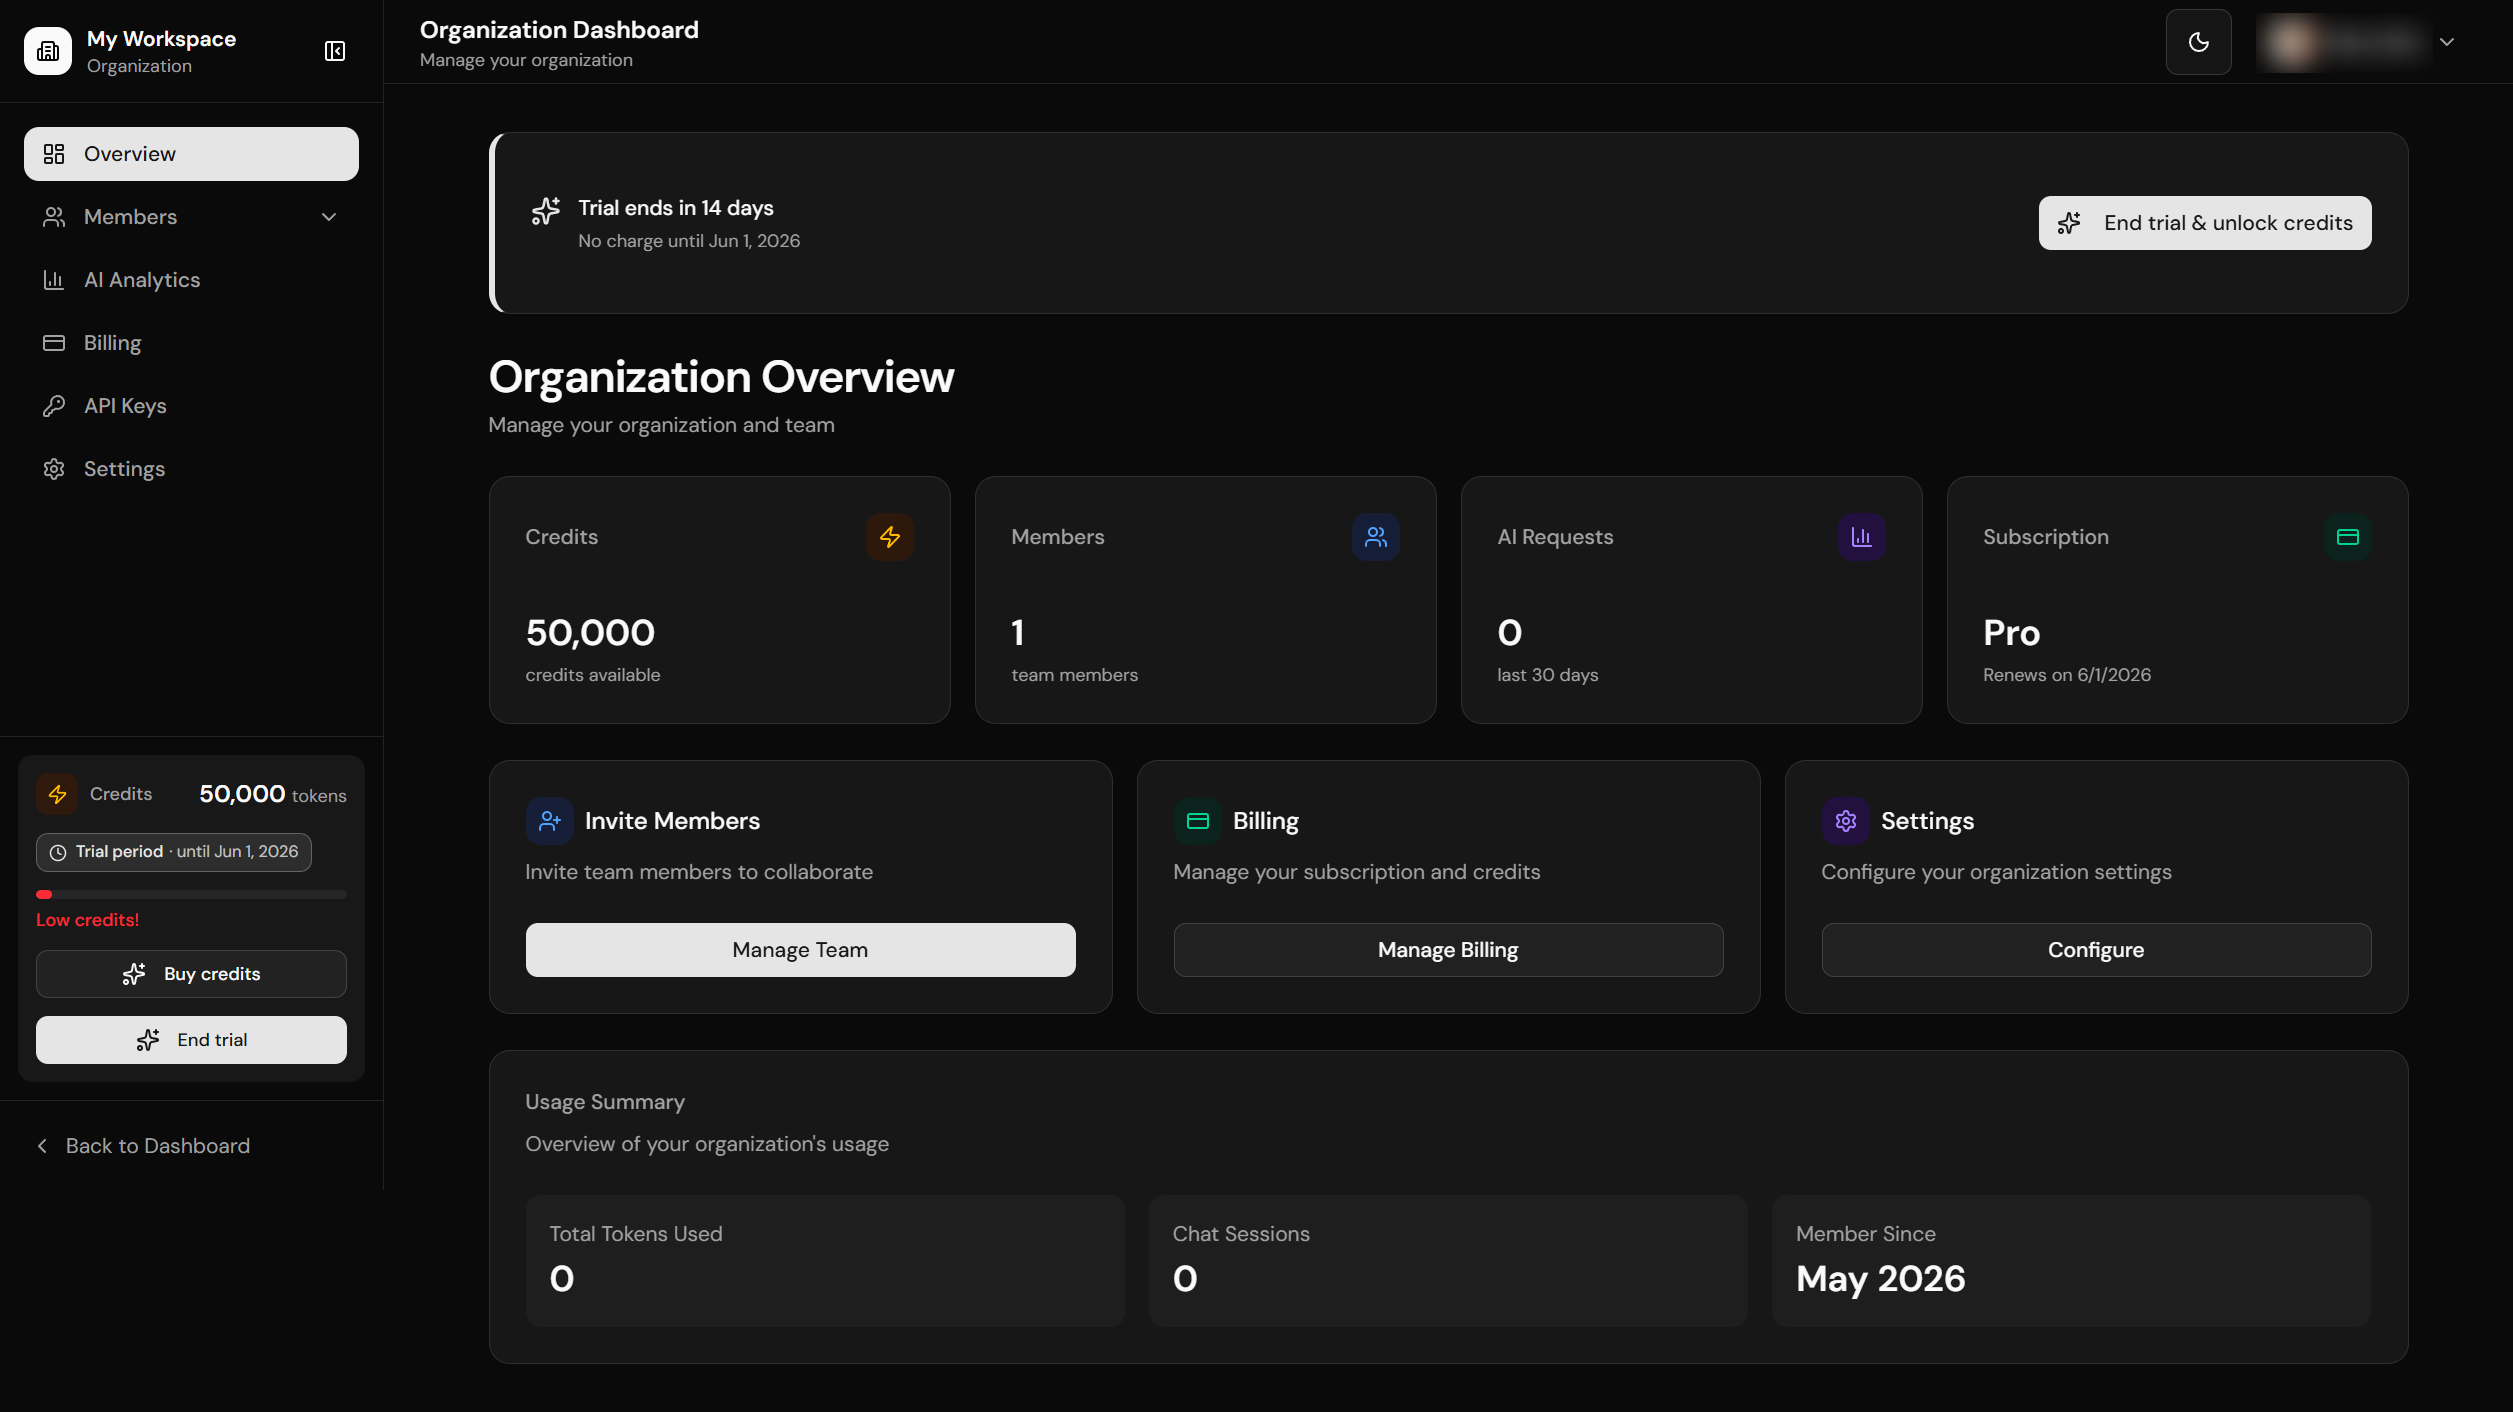
Organization dashboard overview
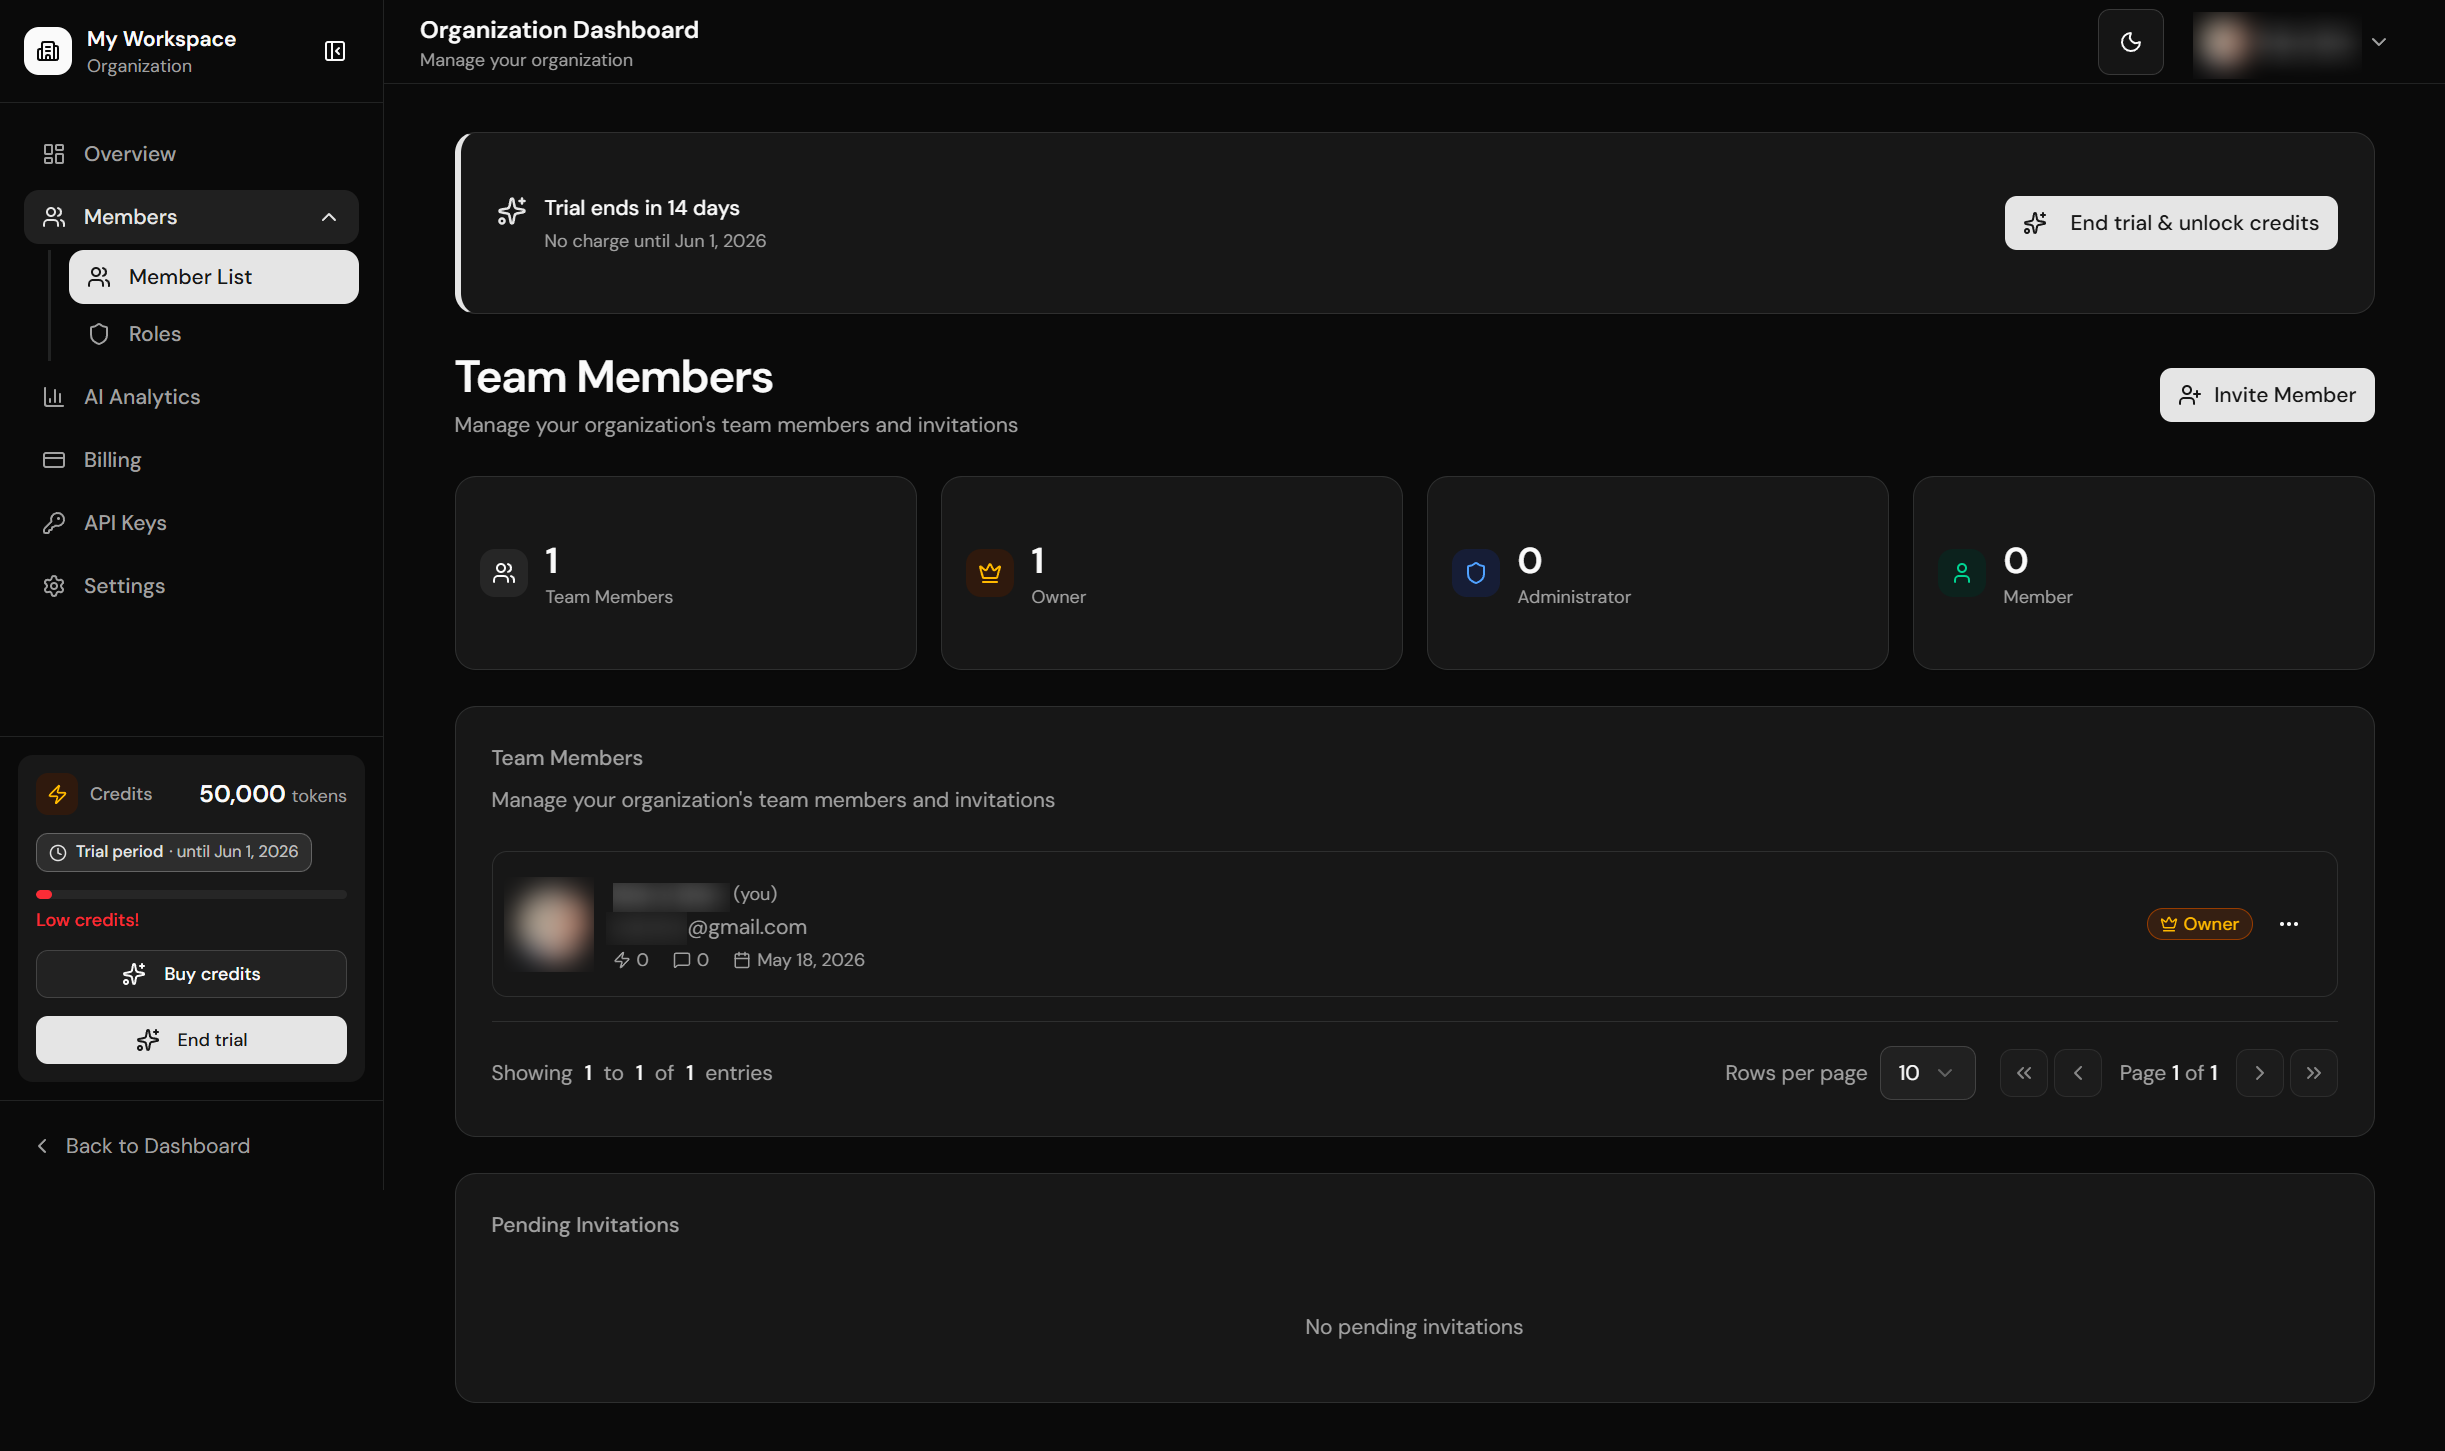
Team members management
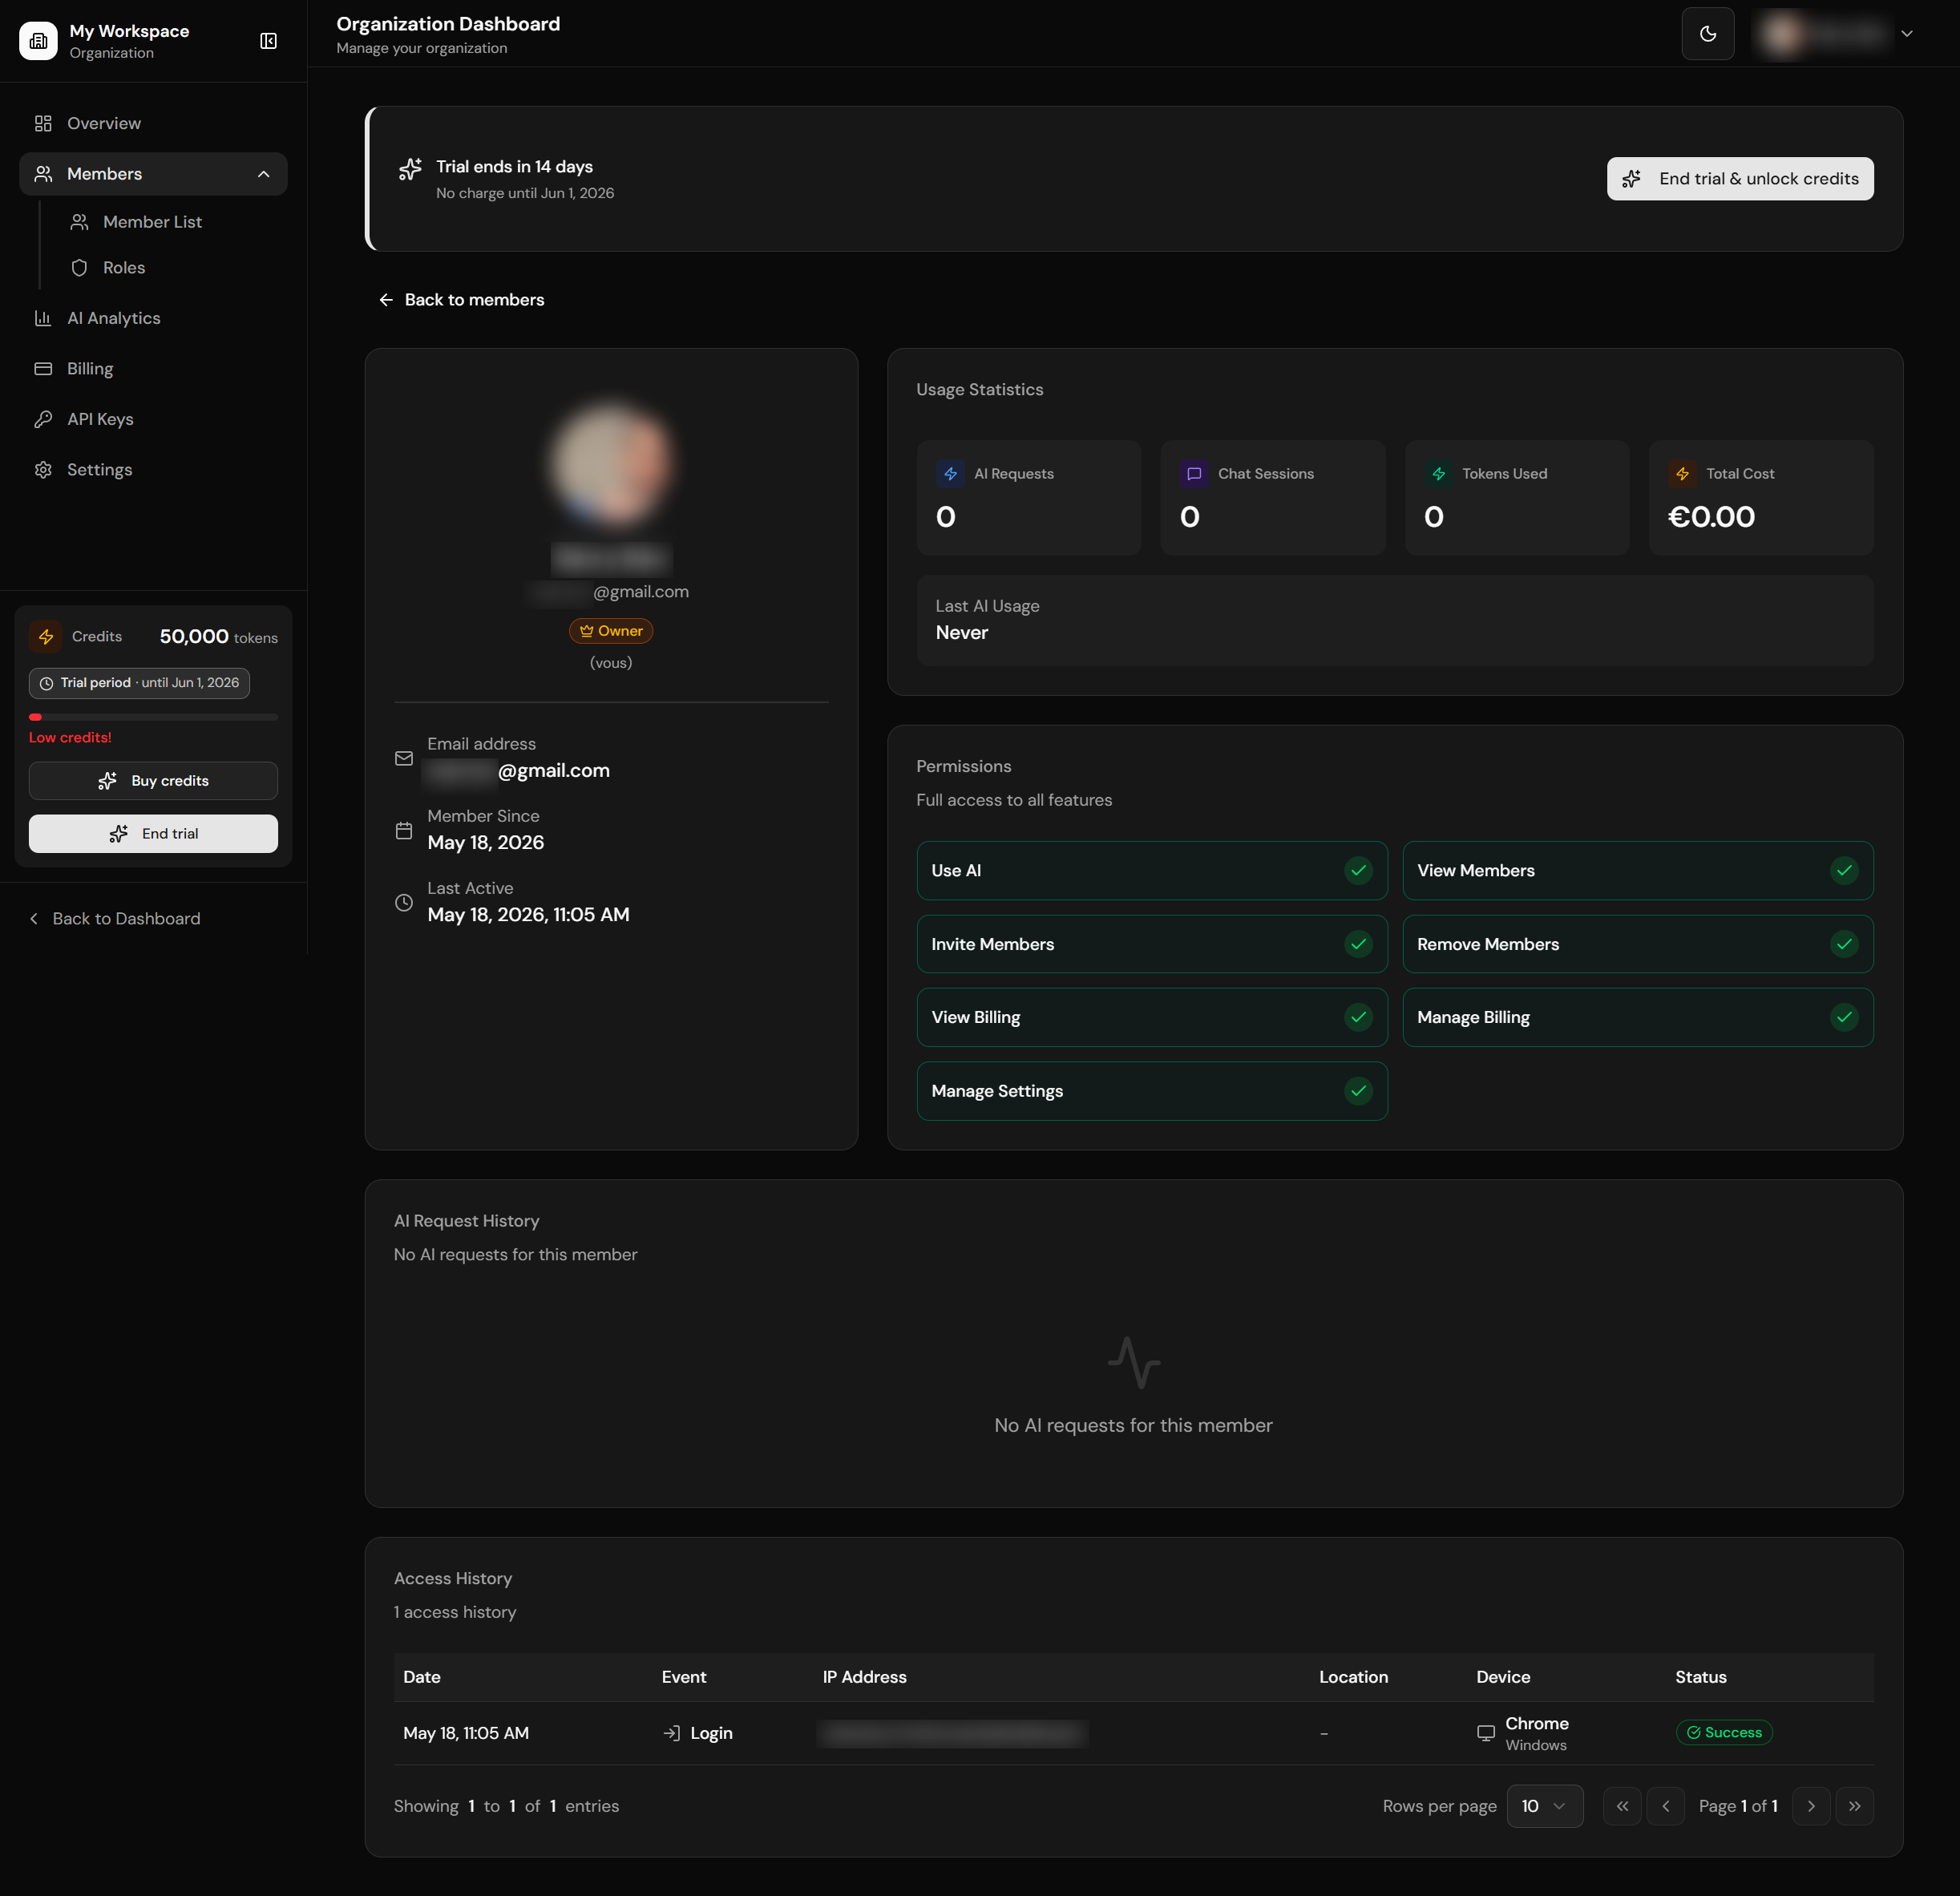
Member detail with usage stats
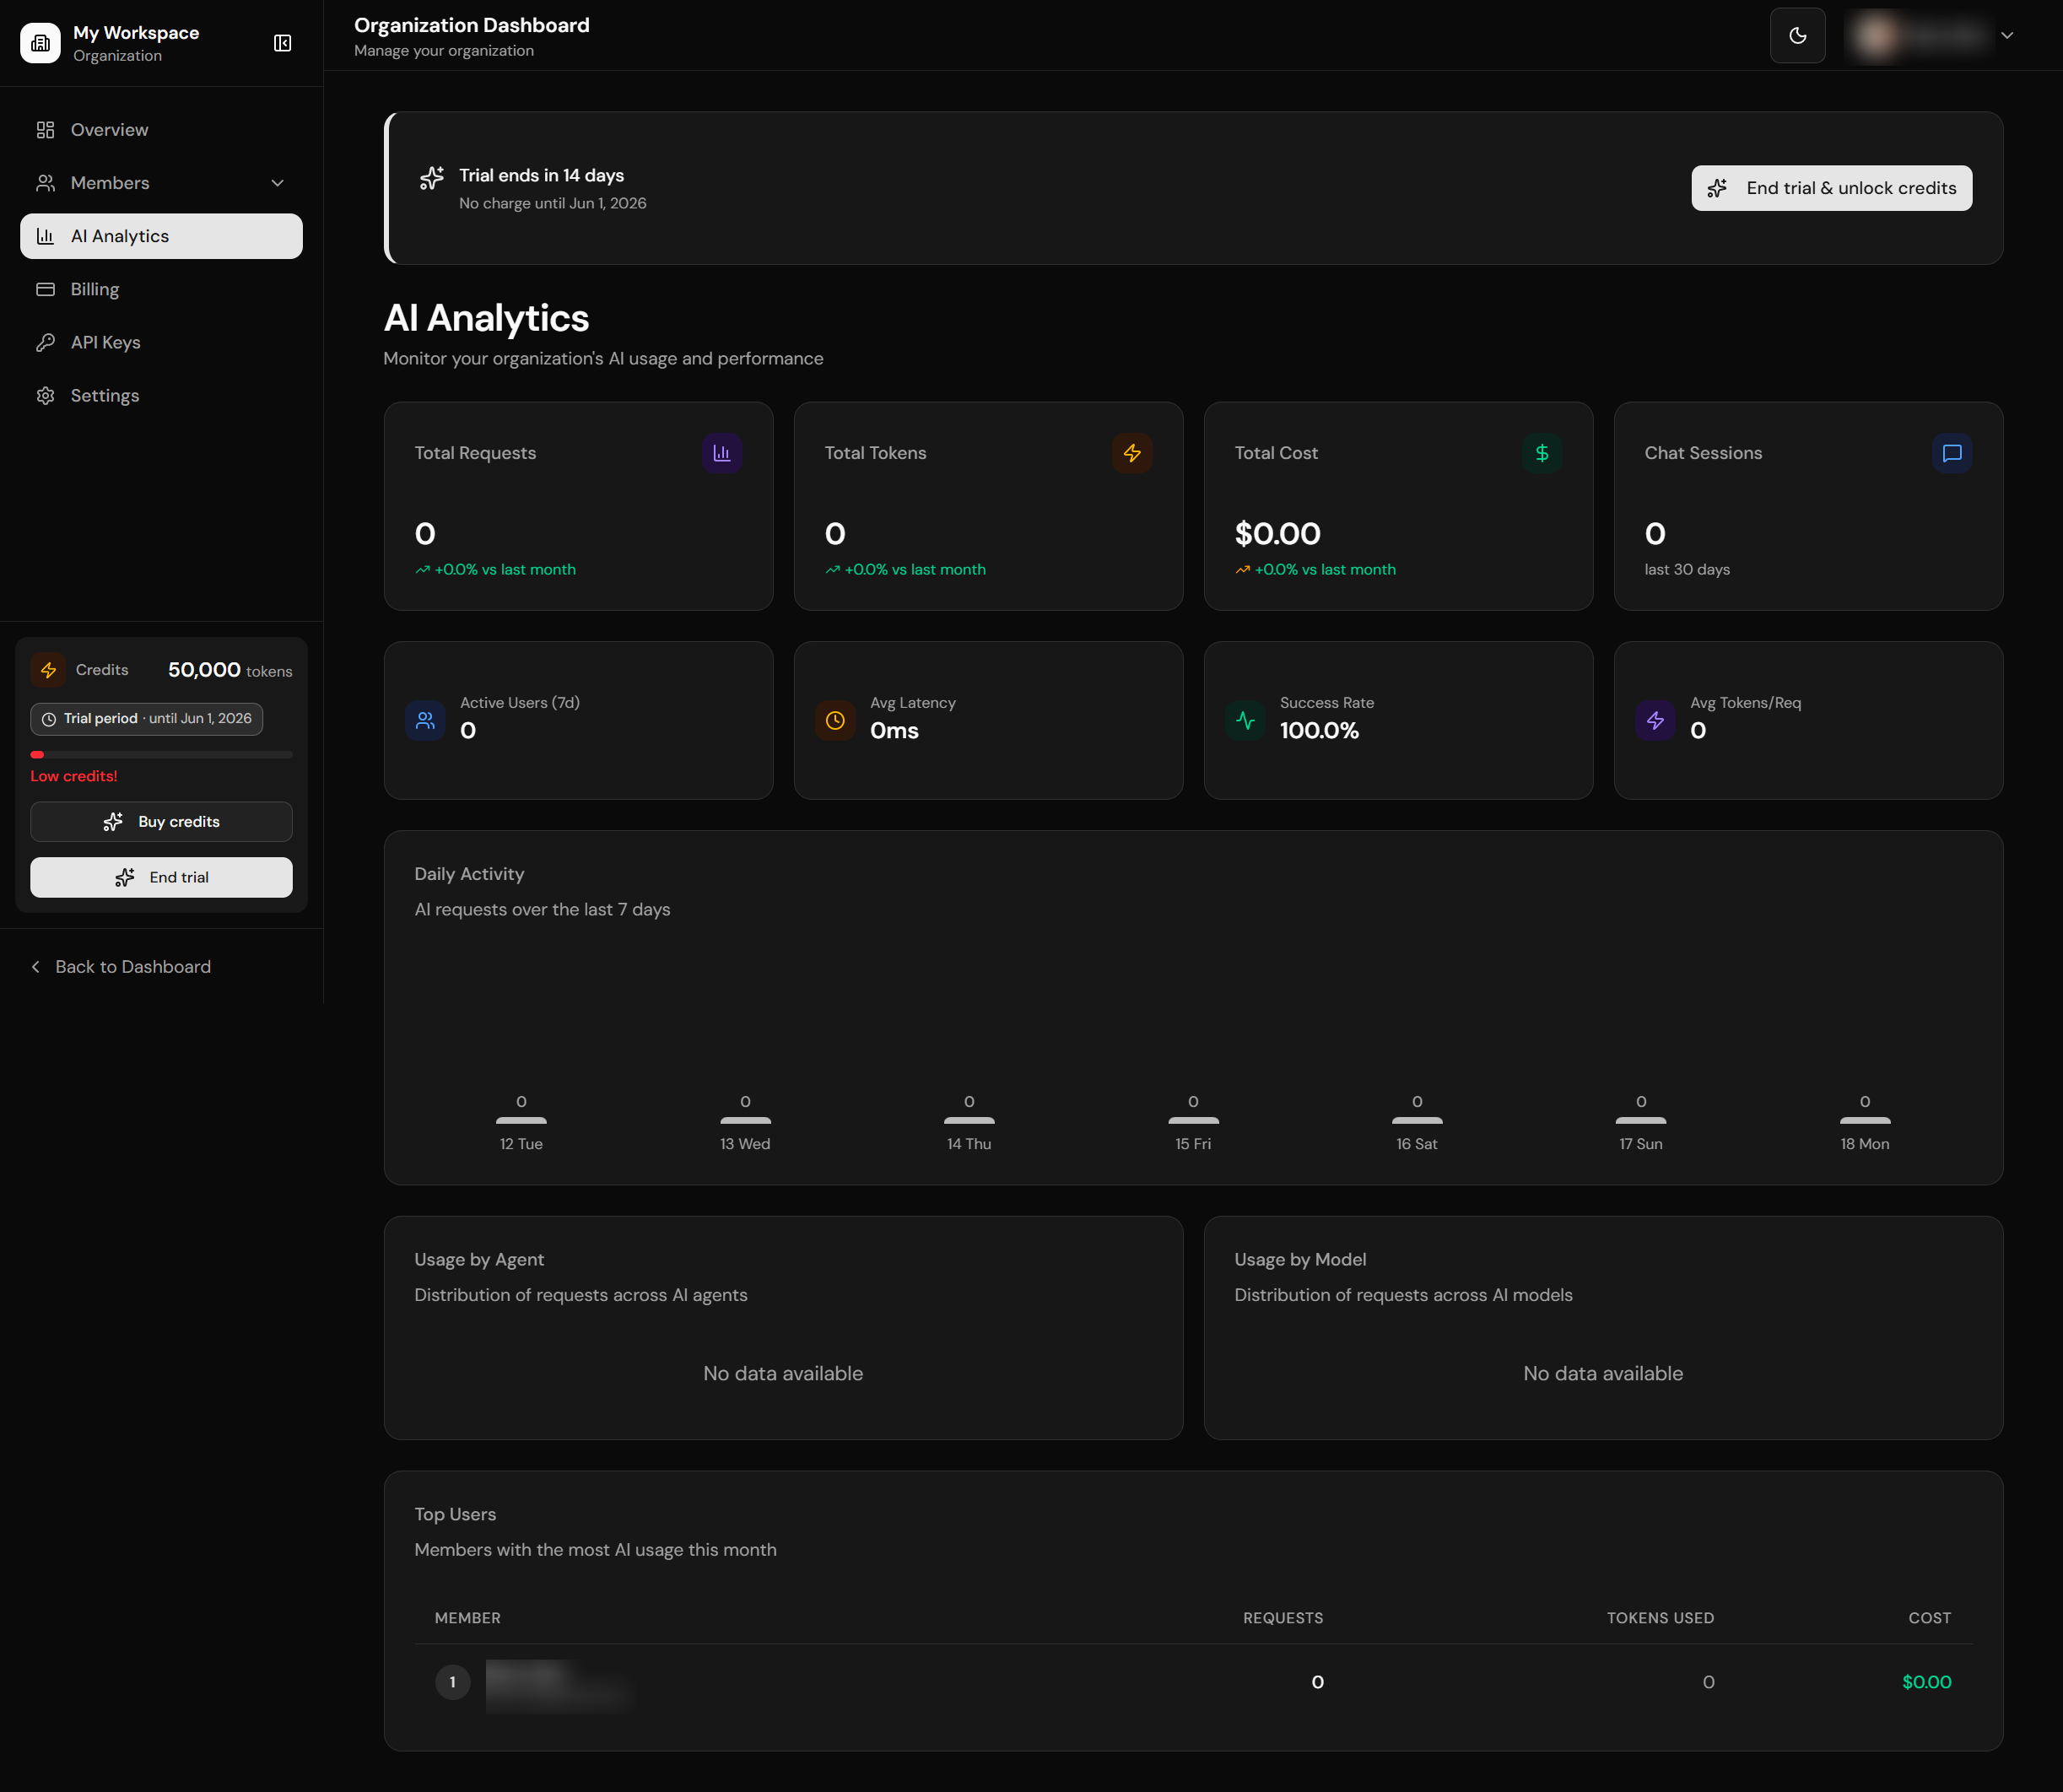
AI usage analytics
| Page | Path | Features |
|---|---|---|
| Admin | /org-dashboard/admin |
Workspace admin overview / management |
| Members | /org-dashboard/members |
Team list with pagination, invite form, pending invitations |
| Member Detail | /org-dashboard/members/[id] |
Usage stats, permissions, AI logs, access logs with pagination |
| Roles | /org-dashboard/members/roles |
Role overview, permission matrix |
| Billing | /org-dashboard/billing |
Credits balance, credit history, Stripe portal |
| Settings | /org-dashboard/settings |
Org name/slug, danger zone (deletion) |
| API Keys | /org-dashboard/api-keys |
B2B API key management (create/revoke, scoped) |
| Analytics | /org-dashboard/analytics |
Workspace AI usage analytics |
Pagination
Tables include reusable pagination controls:
- Rows per page selector (5, 10, 20, 50)
- Page navigation (first, previous, next, last)
- "Showing X to Y of Z entries" display
- Page indicator (Page X of Y)
- Independent pagination state per table
Shared Dashboard Context
The private and organization dashboards share request-level context helpers in core/accounts/dashboard-context.ts. They use React.cache() to deduplicate repeated auth/account reads between a layout and its child page during one request.
| Helper | Route family | Context |
|---|---|---|
getPrivateDashboardContext() |
/private-dashboard/* |
Current user, profile, memberships, pending invitation token, active account, billing access, credits, trial state, admin/org-management flags. |
getOrgDashboardContext() |
/org-dashboard/* |
Current user, profile, manageable workspaces, current workspace, member count, active subscription, billing access, trial/Stripe state. |
These helpers are not static caches. They read the current request session with getUser(), so they remain appropriate only for protected dynamic routes. Layouts and pages still own redirects: unauthenticated users go to login, users without org-manager membership go back to /private-dashboard, and B2B workspaces without access go to pricing.
Organization Dashboard Performance
Organization dashboard analytics and member usage stats are pre-aggregated in SQL instead of loading raw usage rows into the page component. Keep this boundary when adding new dashboard cards:
core/accounts/dashboard-usage.tswraps the aggregate readers used by the private dashboard overview, org overview, org analytics, member list, and member detail pages.get_org_dashboard_analyticsreturns 30-day KPIs, previous-period comparisons, daily usage, top members, model/agent breakdowns, active users, latency, and success rate for/org-dashboard/analytics.get_org_member_usage_summaryreturns per-member request count, token total, cost, last AI activity, and chat-session count for member list/detail screens.get_account_dashboard_usage_summarypowers lightweight overview counters without downloadingai_requestsorchat_sessions.- Supporting indexes cover
ai_requests(account_id, user_id, created_at desc),chat_sessions(account_id, user_id, created_at desc), anduser_access_logs(user_id, created_at desc).
Do not add dashboard code that fetches all ai_requests or chat_sessions for an account and then groups them in JavaScript. Use an aggregate RPC, a bounded latest-activity query, or a head: true count query depending on the UI.